 Author: Jared Michalec, VP of Client Services
Blueworks Live from IBM is a very powerful yet intuitive platform that is used by businesses, large and small, around the globe. If you have not tried it, I highly recommend taking a look – you can even sign up for a 30-day free trial here.
Its main focus is to enable organizations to discover, model and document their core business processes in a centralized, standard way. We often refer to it as “Visio on steroids” but really it is about adding business- and process-specific metrics and measurements to what you would traditionally capture in drawings. Whether you are a new user, or very experienced, there are a variety of resources for you to tap into including: user groups, monthly “Ninja” sessions, and much more.
I have been using Blueworks Live since 2009 when IBM acquired the company Lombardi, and with it the platforms we now know as Blueworks Live, as well as Business Automation Workflow (formerly Business Process Manager, and before that Lombardi Teamworks). I was at IBM during this time and being on the Worldwide Technical team. I helped with the acquisition transition and training of IBMers on these new capabilities. Since then we have seen Blueworks Live take over the process modeling world and become the standard platform for many process excellence initiatives.
Throughout my time at IBM, and now with my current company Salient Process, I have worked with countless customers who need additional reporting and visibility to the data they have captured in Blueworks Live. Early on, IBM provided access to this information via the supported REST API; so with a bit of development, we were able to surface a lot of valuable information.
While delivering a one-off solution via a consulting engagement did provide value to clients one project at a time, we determined there had to be a better way. This is how the Blueworks Insights platform was born. The developers at Salient Process pooled their knowledge and experience, as well as the input from all those customer engagements and discussions, and centralized it into a standalone solution that we initially provided to our larger Blueworks Live clients. While it started off somewhat modestly, the feedback we received over the first 6 months contributed to incredible growth, and it went from a simple reporting tool to a true extension to Blueworks Live and continues to grow with each release.
Blueworks Insights not only enhances the experience of the platform, but truly expands it with additional capabilities and broadens the user base to those that were not willing or able to use the IBM solution previously. The following are some of the features and functions that the tool provides to users of Blueworks Live.
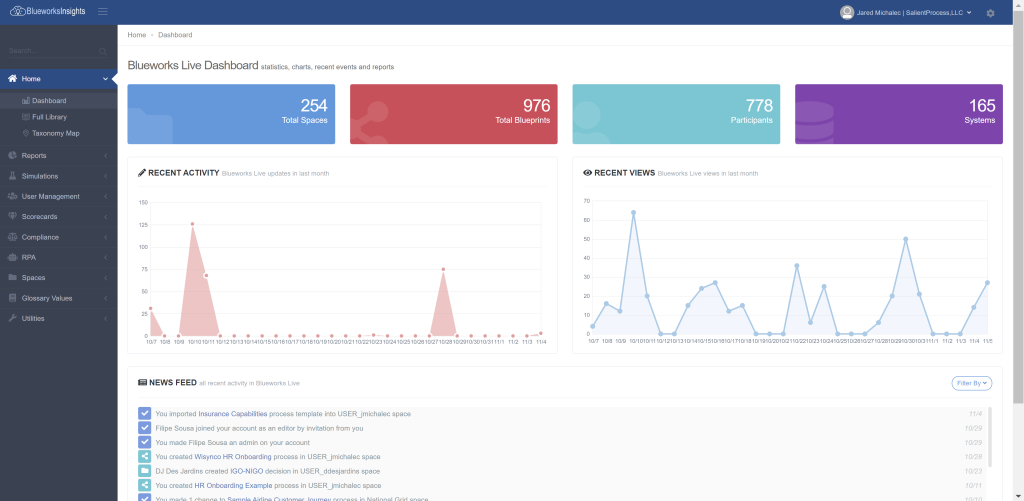
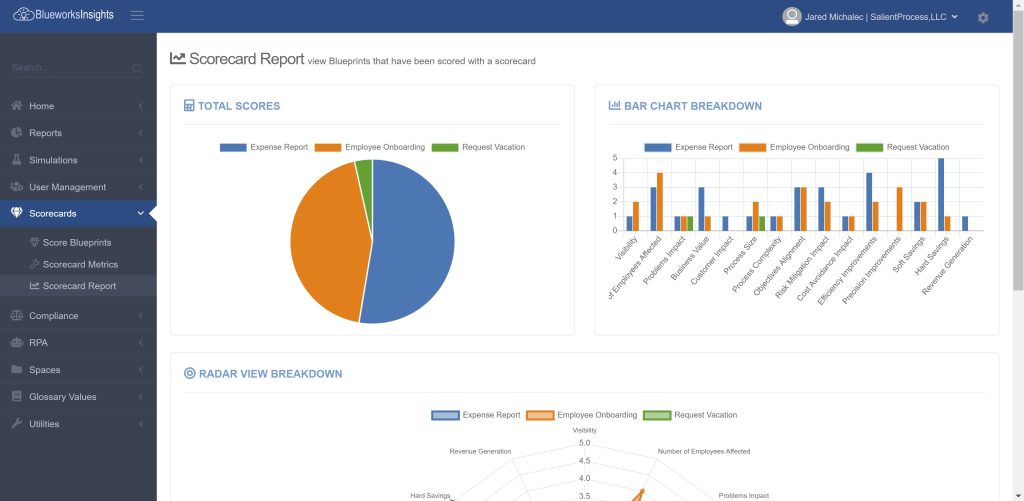
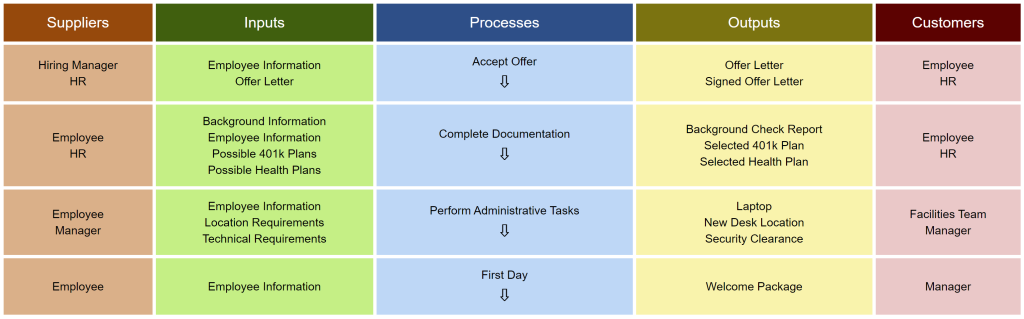
Historically, the low-hanging fruit for pulling the critical business data to the surface was in the form of dashboards and reports. We compiled the most commonly requested reports from previous and current clients and provide those dashboards automatically through the Insights platform. These reports include:
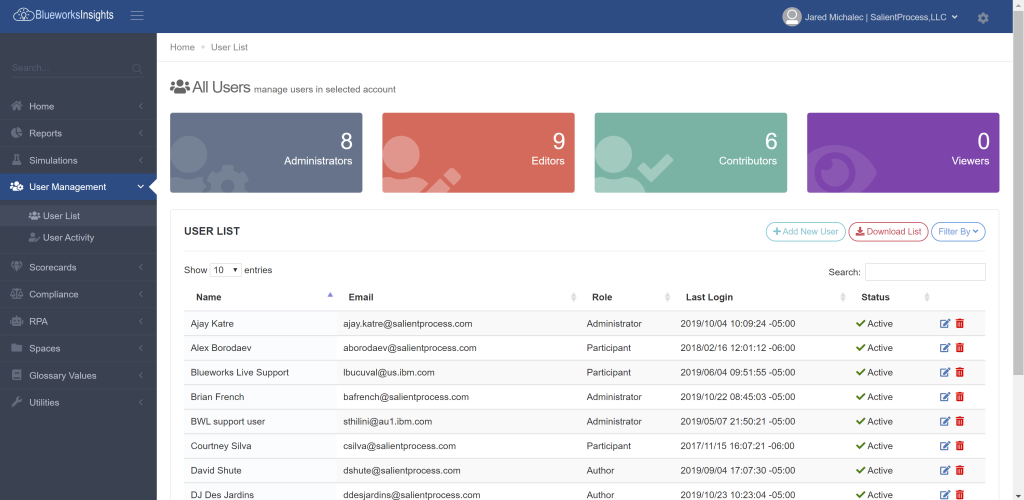
Blueworks Live does a good job at viewing basic information about users and makes it easy to onboard new ones. However, there are times when administrators want to provide their users with a more consistent onboarding experience. This can include links to documentation, videos and specific governance Spaces in Blueworks Live itself in order to enable those new users much more quickly. In addition, today administrators of Blueworks Live need to log in and monitor user logins to determine which users are not using the tool. Using Insights, administrators can establish automated reminders when a user has not logged on within a period of time, and even automatically de-provision a user if they have not used Blueworks Live for an extended time (i.e. 3 months).
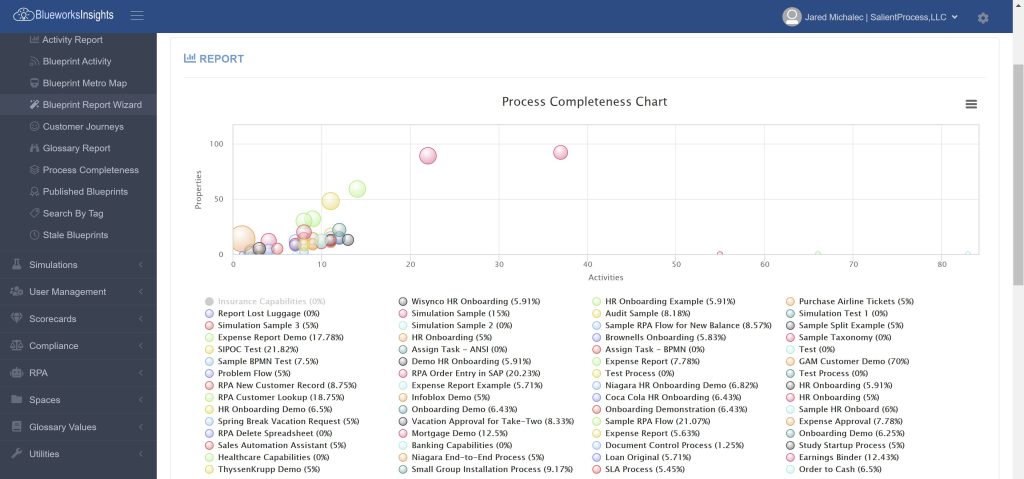
While Blueworks Live does a great job of allowing users to capture properties and measurements of the Activities of a Blueprint, there is not a way to capture data about the Blueprint itself. In Insights, users can add additional, customized metrics in order to “score” or “prioritize” the Blueprints. These metrics can include more subjective measurements such as “Visibility” or “Impact to the Customer”. Further, this also enables users to do something that is difficult to do in Blueworks Live: compare metrics across multiple Blueprints. Users can identify key opportunities and prioritize Blueprints for potential process improvements or even for automation projects.
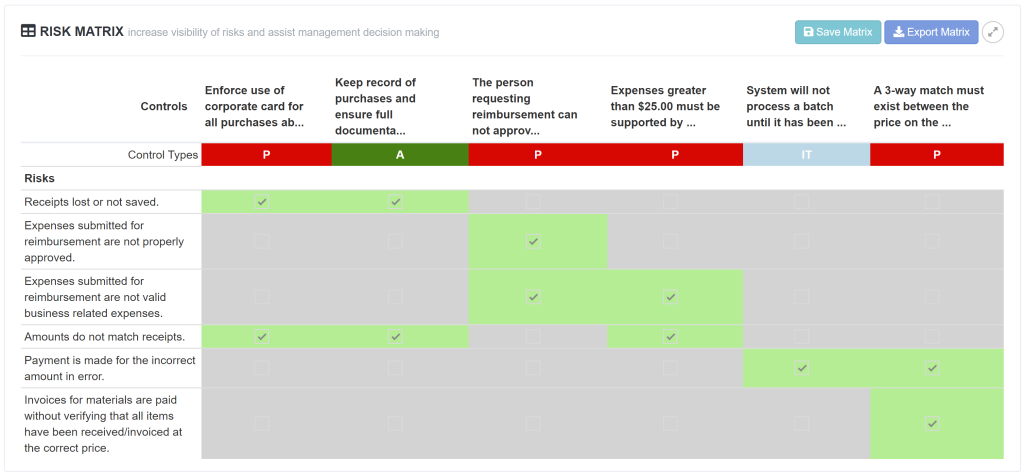
Expanding on the concept of Scorecards, Insights also provides users the ability to capture specific compliance or audit measurements and metadata on the Blueprints or Activities in the form of Risks and Controls. Users can then associate the Risks and Controls into a dependency matrix to better understand the mitigation, impact and exposure of the documented Risks.
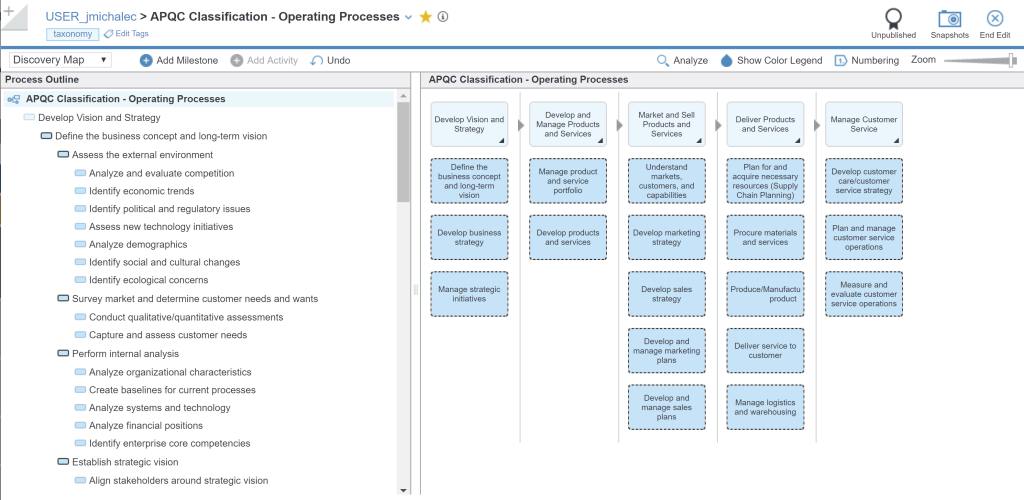
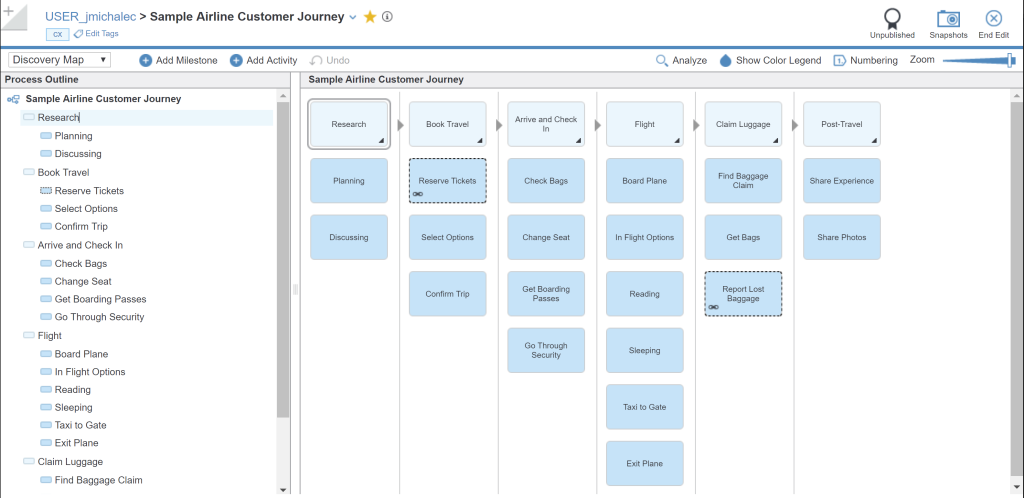
Over the years, I have worked with many Lean Six Sigma teams and other process improvement groups on their adoption of Blueworks Live. One of the limitations we run into consistently is how to capture the process hierarchy and follow standard principals such as APQC. Traditionally, the most common approach to creating these process structures was via Spaces, treating them like folders and sub-folders to create the hierarchy. However, the conflict that often comes up is that Spaces are also the way to manage user access, so administrators and process leaders are forced to choose between a structured hierarchy, and more granular control of users and groups. With some of the new functionality in Insights, these process hierarchies can now be captured in a single Discovery Map. This provides two important capabilities. First, Insights can now provide alternate visualizations of the Discovery Map so that it looks much more like a process hierarchy or value stream. Second, within the Discovery Map, users can link the core process (such as at the L4 level) to the actual Blueprint – this way, the actual location of the Blueprint does not matter so Spaces can go back to being more project-specific and can be utilized to manage user roles and responsibilities.
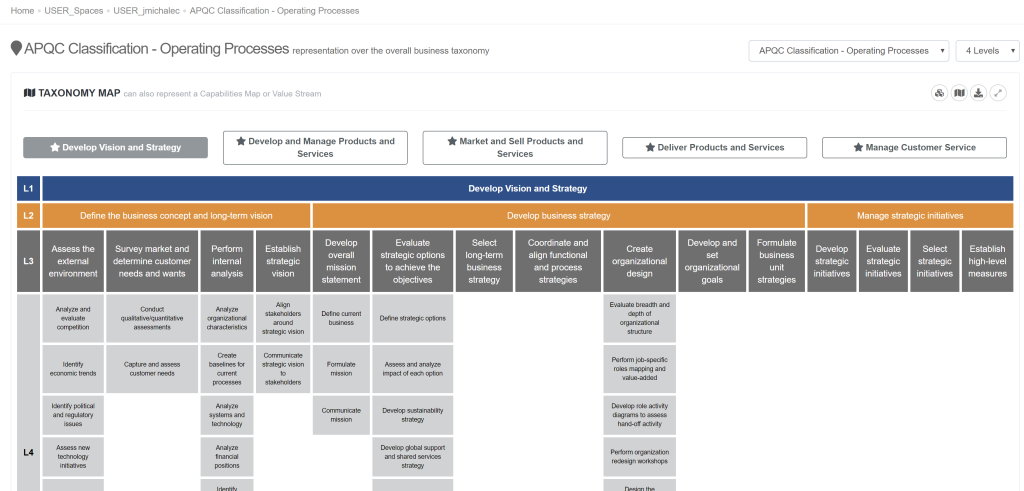
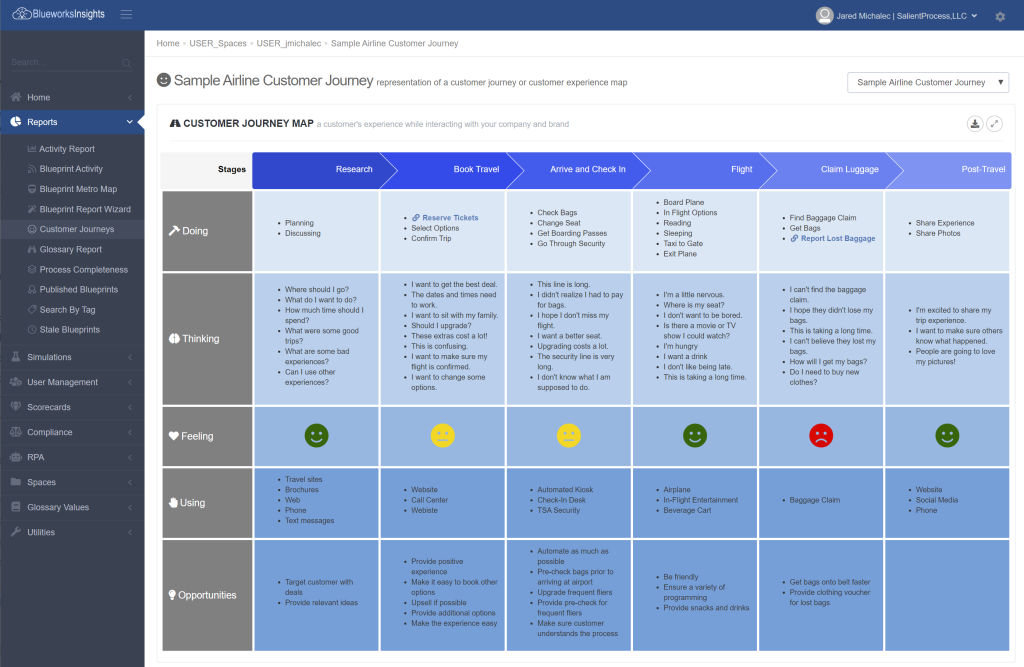
Building on the theme of changing the visual of the Discovery Map, Insights now allows for the visualization of new charts and diagrams without needing to input anything more than what is being captured in Blueworks Live.
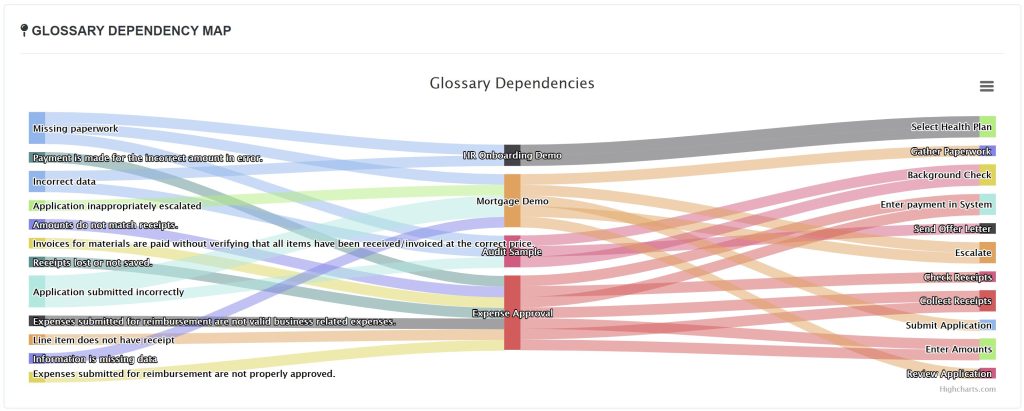
One of the most powerful features of Blueworks Live is the Glossary. This includes the ability to not only capture the metrics and measurements on the Blueprint and Activities, but to also maintain the dependencies from those metrics back to the related Blueprints. However, it is not always easy to surface and visualize those dependencies. Insights gives additional reports and charts to show how the various metrics are related.
In addition to the new reporting abilities, Insights can also act as a “bridge” between core applications within a business and Blueworks Live. This way the business application remains the source of truth and it is no longer necessary to manually sync between the two systems.
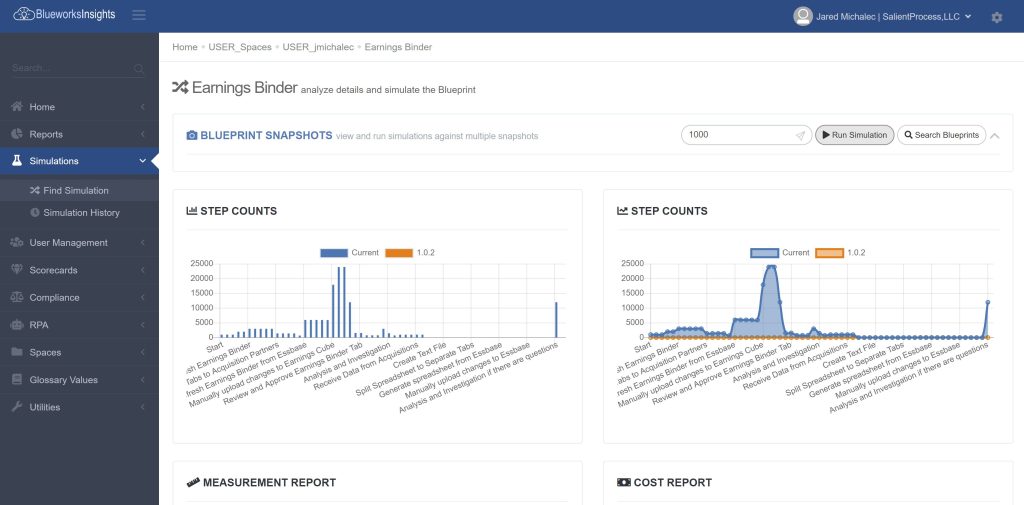
I cannot count the number of times I have been asked by clients about being able to simulate the process models they have captured in Blueworks Live. In most cases they are not looking for highly sophisticated scenarios with multiple variations and algorithms, rather just to run some data through the models and see some of the results. This got us thinking about what we could provide in Blueworks Insights and if we could add just a couple configurable assumptions, then we could start to see some interesting results. The two inputs we needed to add in order to start simulating were: 1) Volume through the process (i.e. number of times a process starts in a day), and 2) Percentage of each exclusive gateway branch (i.e. how often something is approved). Once we added those variables, we were able to create an engine to quickly simulate data through a process and view the results, both at the Activity level, as well as for the overall Blueprint. This can also identify bottlenecks and rework loops with little or no input needed from the user.
The current capability Insights offers in this area is only the beginning. There are many other dials and knobs we can add, and a lot more details and understanding to expose. In addition, because much of this can be captured and processed automatically without the need for direct user involvement, this would enable the platform to automatically highlight new opportunities for improvement and automation.
With the success that Blueworks Insights has had with our current user base, you can understand why our backlog of requests continues to grow. We prioritize each of these and are delivering new functionality on a monthly, if not weekly basis. Where we see one of the larger opportunities is in the area of quantifying the value of process improvement and overlaying that with the effort it would require to implement. This could help organizations justify and prioritize projects, specifically in the area of automation. Users will be able to use IBM Blueworks Live to collect the critical business data and use Insights to automatically identify not only process or workflow opportunities, but also automation in the form of business rules, robotic process, document capture and content storage. As an IBM partner, we are very excited that this corresponds directly to the platform strategy that the IBM Cloud Pak for Automation offers. In this way, Blueworks Insights can help Blueworks Live deliver on the promise of more holistic, strategic process excellence, and truly be the entry point for end-to-end Digital Business Automation initiatives.
We at Salient Process are very excited by the success we have already achieved with the platform, and the incredible support from IBM and our clients throughout this journey. If you are interested in seeing a brief demonstration of the platform or to receive more information feel free to reach out to us at [email protected]. You can also register for a free trial of Blueworks Insights here. We continue to offer the platform for free to our Blueworks Live clients and only ask for feedback on how we can make the experience better for you. I look forward to hearing from you!
Salient Process is a full-service digital business automation shop and proud IBM Automation business partner. To learn more about us at our website, request a free consultation with one of our expert automation advisors! We look forward to guiding you and your company along your own unique Digital Business Automation journey.