 Author: Jared Michalec, VP of Client Services
This is the second entry in a series of blogs we are authoring around Salient’s exciting IBM Blueworks Live accelerator called Blueworks Insights. If you missed the first one which provided a background on the platform, you can read up on it here.
Let me start by saying I am not a compliance or audit expert; my background is in process improvement and automation. That said, over the last year I have met with countless clients on the topic of leveraging IBM Blueworks Live in order to document risks and controls, to surface potential exposures and to demonstrate that the company is complying with regulatory requirements. This is already being done by many organizations around the world with the base IBM Blueworks Live platform. However, it became very clear that there were some key features missing that would truly achieve the goals of the compliance and audit teams. This is where Blueworks Insights comes in.
While the Blueworks Insights tool started as a reporting and analytics platform that could surface and visualize important data in the IBM Blueworks Live repository, we have been adding additional modules based on customer feedback and new understandings.
One interesting area we have been exploring is adding the capability to compliment the information in IBM Blueworks Live with new data that cannot be added in the IBM platform. This started with more subjective measurements of the Blueprint such as “visibility” and “customer impact” which can be captured in what we now call “Process Scorecards.” The Blueprints could then be compared and prioritized across multiple dimensions. This approach is what inspired some thoughts about how to add compliance-specific measurements to the Blueprint as well. Blueworks Insights currently provides two methods to assist in documenting risks and controls, and the related details.
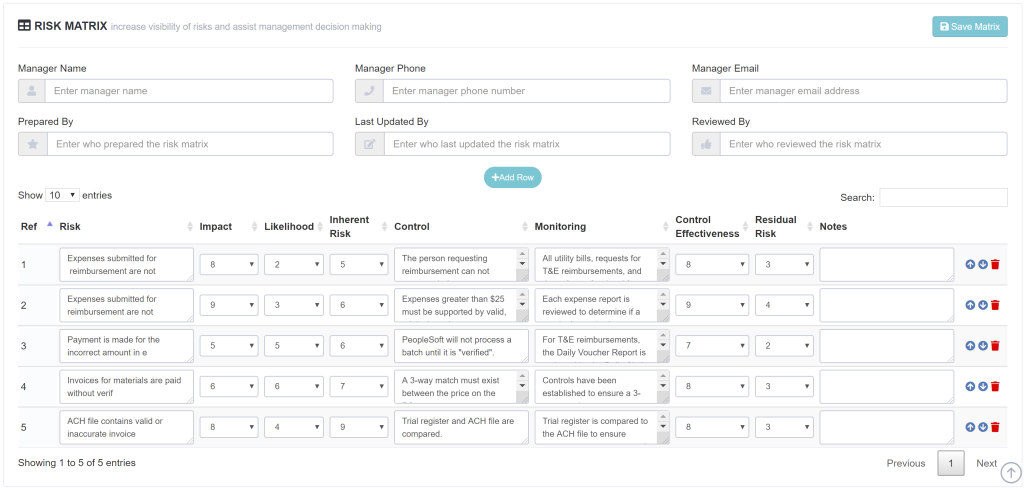
Based on feedback from clients, our first method of documenting risks and controls stemmed from the process scorecard capability in Insights where users can assign measurements to the Blueprint. This does not require anything to be added in IBM Blueworks Live other than the Blueprint itself. All the data is collected in Insights.
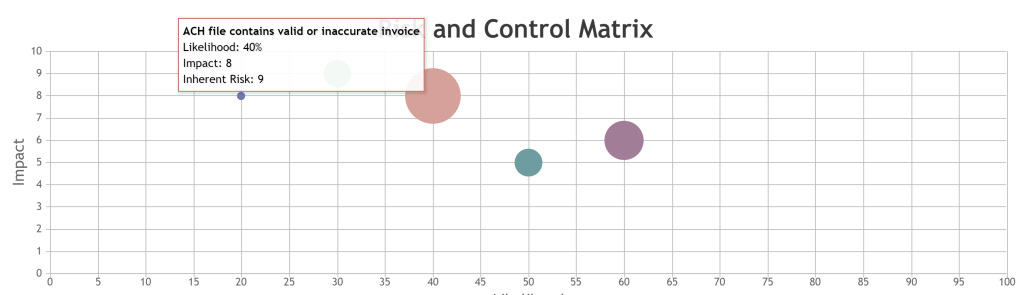
Once the risk/control information is added to the Blueprint in Insights, the details can be visualized in charts and graphs like the following example. In Figure 2 you can see we are visualizing the Impact (Y axis) vs. Likelihood (X axis) of the risks, and the size of the circle indicates the Inherent Risk of each entry.
Finally, a key benefit of Blueworks Insights is its ability to not only surface information about the Blueprint itself, but to compare multiple Blueprints at a time. The risk/control information is no exception. The following shows an example where we are comparing the risks, controls and other details across three Blueprints.

An alternate method to identify the risks and controls of a given process is to allow users to add the details directly to the activities in IBM Blueworks Live. This is done by adding two custom fields – for the sake of this discussion we will call these fields “RCM Risk” and “RCM Control”. This is how many organizations currently capture risk/control details about a given Blueprint, even without the addition of Blueworks Insights. However, there are some potentially significant gaps in this approach. First, while this works very well when there is a single risk and single corresponding control to each activity, this is not always, or even often, the case. Many times, there will be many risks and many controls on a given activity – so how would you know which controls apply to which risks? Or, even more complicated, what if a control on one activity applies to a risk on a separate activity? This is where Blueworks Insights enters the picture.
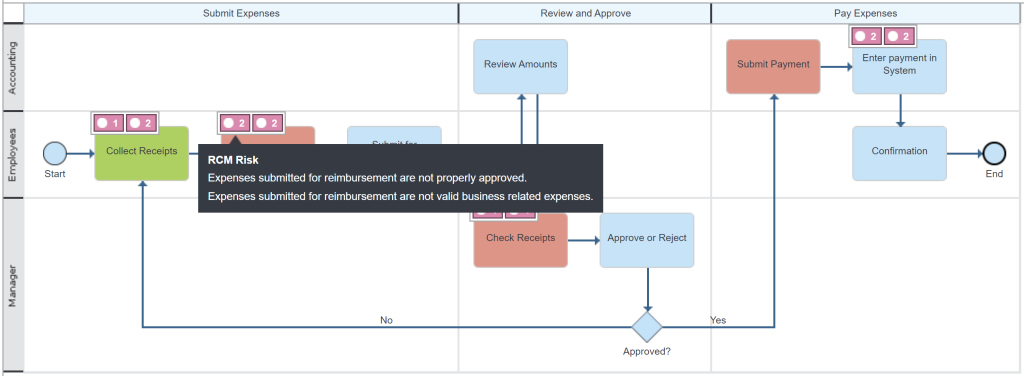
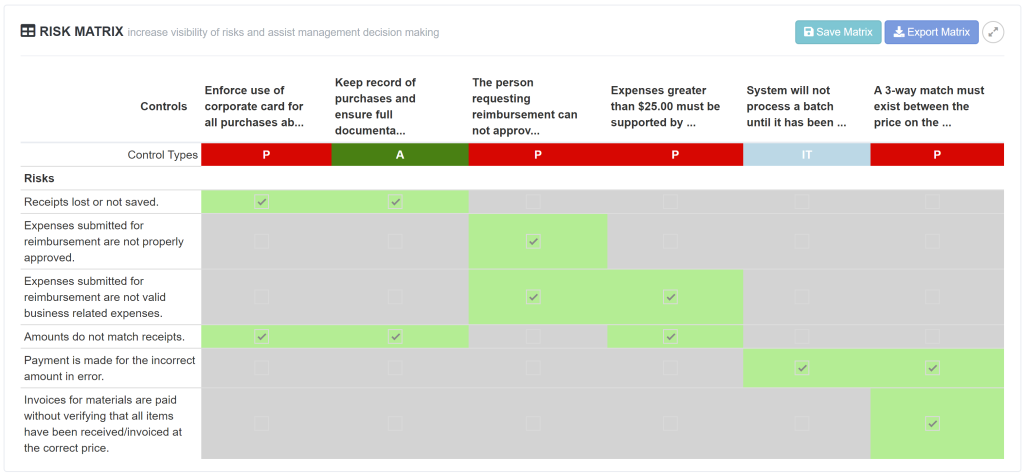
Once the risk and control details are added to the Blueprint in IBM Blueworks Live, users can log into Blueworks Insights and navigate to the Blueprint in order to add some additional detail. Specifically, in the form of a “Risk Matrix” where the dependency between the risks and controls within the Blueprint can be established. This is currently provided through checkboxes that users can tick to identify where the risks and controls intersect, thus adding the last piece to the risk/control puzzle.
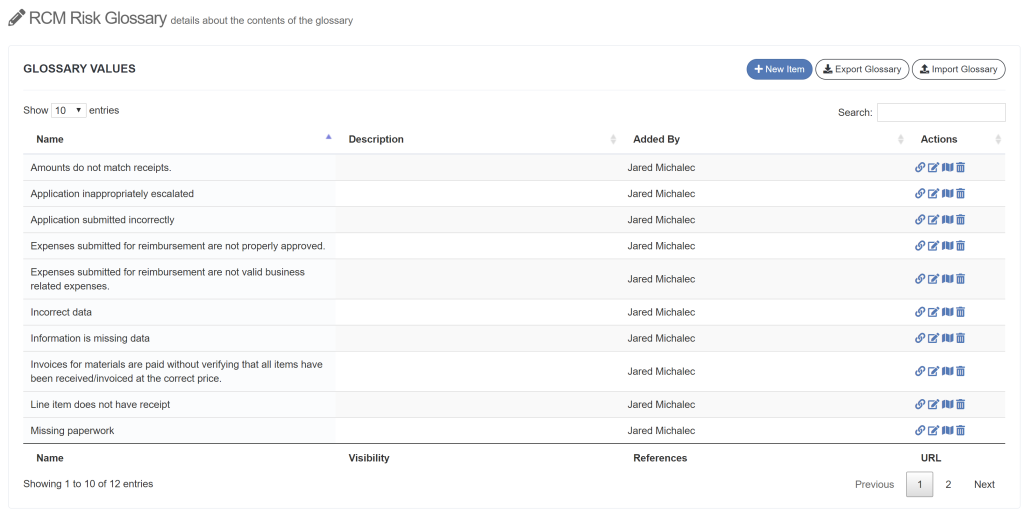
Capturing the risk/control information in IBM Blueworks Live provides us with additional capabilities as well. Since these entries are entered as Glossary values, we have access to the same reports and graphs provided for all Glossary terms in Blueworks Insights. These visualizations assist users in better understanding dependencies and connections and how these Glossary values are being used. The following chart shows how the risks (on the left) are connected to Blueprints (in the middle) and even down to individual activities (on the right).

It is important to note that we are not attempting to make IBM Blueworks Live or Blueworks Insights into a GRC tool. The value of this approach is due to the core business processes that are discovered, diagramed and documented in the IBM platform. By linking risk/control details to those Blueprints we can better understand and evaluate exposures, mitigations, impact, and how those are tied to an organization’s business processes.
However, there are many cases where risk/control definitions and documentation already exist within an organization, typically stored in a GRC platform. This creates the potential for having two “sources of truth” of the risk/control information which could cause issues and conflicts. In these cases, we have given our clients the option to use Blueworks Insights as a “bridge” between the IBM Blueworks Live Glossary and the GRC repository. One method to do this is to periodically import the risk/control definitions using Insights’ Glossary Management module.
Alternatively, in some cases we have directly integrated IBM Blueworks Live with the existing GRC tool. This integration basically synchronizes the information and surfaces any potential conflict for an administrator to resolve. Both approaches have their pros and cons, but we have effectively mitigated the “risk” of managing an organization’s risks and controls.
As with all the features in Blueworks Insights, we at Salient will continue to improve and expand the capabilities of the compliance and audit module. This development is largely dependent on how our clients are using the platform, and what additional details and resources would be beneficial to those clients. In addition, we are planning on frequent releases starting this month and will be introducing additional robust risk/control management and reporting features.
If you are interested in seeing a brief demonstration of the platform or to receive more information feel free to reach out to us at [email protected]. You can also register for a free trial of Blueworks Insights here. We continue to offer the platform for free to our Blueworks Live clients and only ask for feedback on how we can make the experience better for you. I look forward to hearing from you!
Salient Process is a full-service digital business automation shop and proud IBM Automation business partner. To learn more about us at our website, request a free consultation with one of our expert automation advisors! We look forward to guiding you and your company along your own unique Digital Business Automation journey.