As a user of our tool Automation Compass, we want to ensure that you are always up-to-date with the latest features, improvements, and bug fixes. That’s why we have implemented release notes on our website, which provide comprehensive information about each update we make to our product.
We encourage you to check out our release notes regularly to stay informed about the latest updates and improvements for Automation Compass. As always, we appreciate your feedback and suggestions, and we look forward to providing you with the best possible user experience.
Learn more about Automation Compass.
In our previous update, we added some exciting new features that will help you prioritize which processes to improve first and create a roadmap. With our new capability ranking, you can now score your processes based on their potential to deliver the highest stakeholder and strategic value (Highest Gain), as well as their current performance relative to what’s needed going forward (Highest Pain).
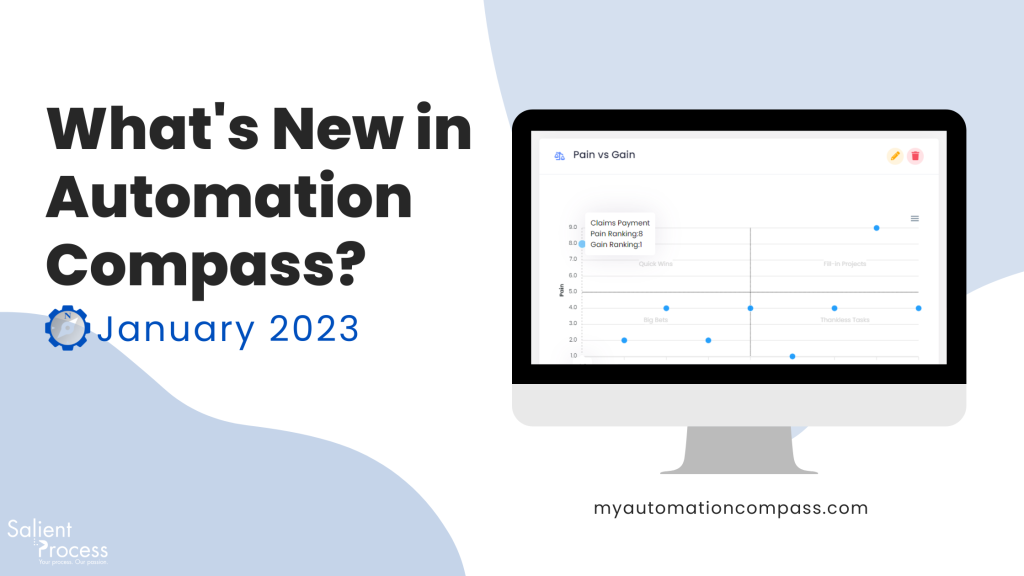
But that’s not all – our latest release includes a helpful widget to visualize all the processes you’ve scored, so you can quickly identify areas for quick wins, big bets, fill-in projects, and thankless tasks. This widget will map the ranking of your processes based on the scoring you provided, allowing you to see at a glance which processes should be improved first.
We’re excited to announce that we’ve made improvements to the way you can update your process models in Automation Compass. We understand that processes are more than just the models themselves – they also include important details, KPIs, stakeholders, and history.
With these improvements, you can now update your process model without losing any of the essential information or relationships your process has, such as links with the capabilities that enable it, or opportunities for further improvement. This will make it easier and more efficient to keep your processes up to date, ensuring that all your process information is accurate and accessible.
With this update, changes you make when customizing column visibility or sorting by columns will be saved automatically. This means that the next time you access the table, your preferred settings will be retained, and you won’t have to spend time customizing it each time you log in.
In addition to these improvements, we have added a new feature that allows you to export the process table in multiple formats, such as XLS, CSV, and PDF. This will give you more flexibility and enable you to share the data in a format that best suits your needs.
We are excited to announce an update to our platform’s “Get Started” wizard. The wizard has been expanded to include guidance for using the heatmap functionalities and process details. This update will make it easier for users to get started with our platform and take full advantage of all its features. Access these guides from the tutorial page.
If you imported your process from Blueworks Live (BWL), you will be able to visualize the process efficiency percentage and a heatmap of the activities in your process. This will provide valuable insights into the performance of your process and help you identify areas that may need improvement.
We are introducing a new calculation method that takes into account the average capability score of the children’s levels to determine the capability score of the parent level

If you’re interested in learning more, you can request a free trial or a demo from an expert advisor. If you’re eager to get started, you can book a meeting here. Don’t miss out on this opportunity, inquire for more information today.
Digital Business Automation Home Page
What is Digital Business Automation?