
Managing Risk with IBM Blueworks Live and Blueworks Insights


Author: Jared Michalec, VP of Client Services


This is the second entry in a series of blogs we are authoring around Salient’s exciting IBM Blueworks Live accelerator called Blueworks Insights. If you missed the first one which provided a background on the platform, you can read up on it here

Let me start by saying I am not a compliance or audit expert; my background is in process improvement and automation. That said, over the last year I have met with countless clients on the topic of leveraging IBM Blueworks Live in order to document risks and controls, to surface potential exposures and to demonstrate that the company is complying with regulatory requirements. This is already being done by many organizations around the world with the base IBM Blueworks Live platform. However, it became very clear that there were some key features missing that would truly achieve the goals of the compliance and audit teams. This is where Blueworks Insights comes in.

Blueworks Insights

While the Blueworks Insights tool started as a reporting and analytics platform that could surface and visualize important data in the IBM Blueworks Live repository, we have been adding additional modules based on customer feedback and new understandings.

One interesting area we have been exploring is adding the capability to compliment the information in IBM Blueworks Live with new data that cannot be added in the IBM platform. This started with more subjective measurements of the Blueprint such as “visibility” and “customer impact” which can be captured in what we now call “Process Scorecards.” The Blueprints could then be compared and prioritized across multiple dimensions. This approach is what inspired some thoughts about how to add compliance-specific measurements to the Blueprint as well. Blueworks Insights currently provides two methods to assist in documenting risks and controls, and the related details.

Approach 1: Attach Metrics Directly in Blueworks Insights

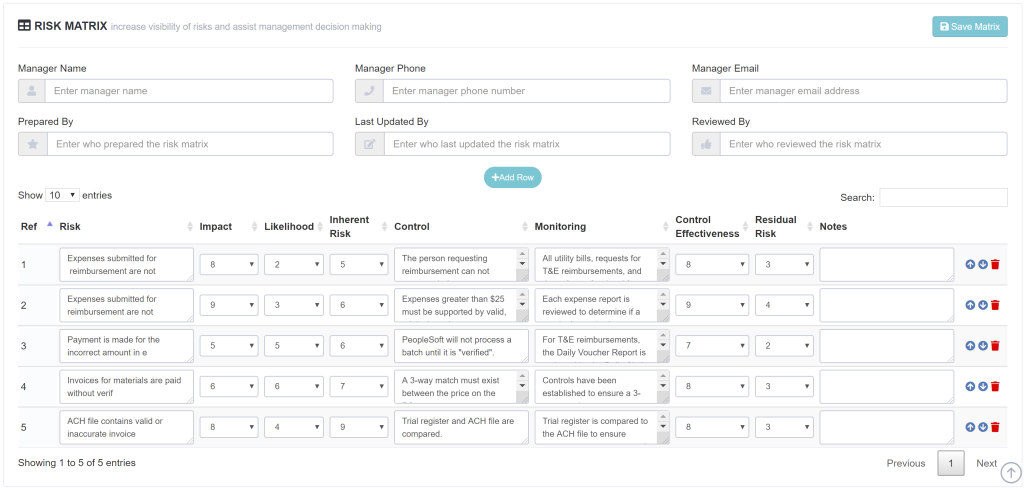
Based on feedback from clients, our first method of documenting risks and controls stemmed from the process scorecard capability in Insights where users can assign measurements to the Blueprint. This does not require anything to be added in IBM Blueworks Live other than the Blueprint itself. All the data is collected in Insights. 

Figure 1: Risk/Control Details
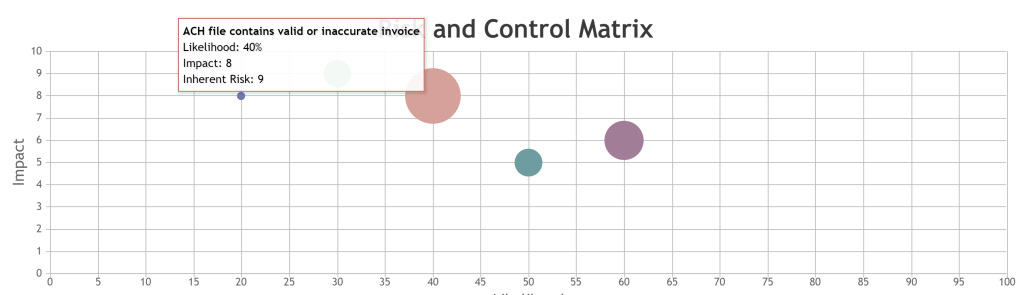
Once the risk/control information is added to the Blueprint in Insights, the details can be visualized in charts and graphs like the following example. In Figure 2 you can see we are visualizing the Impact (Y axis) vs. Likelihood (X axis) of the risks, and the size of the circle indicates the Inherent Risk of each entry.

Figure 2: Risk/Control Chart
Finally, a key benefit of Blueworks Insights is its ability to not only surface information about the Blueprint itself, but to compare multiple Blueprints at a time. The risk/control information is no exception. The following shows an example where we are comparing the risks, controls and other details across three Blueprints.

Figure 3: Risk/Control Comparison Chart

Approach 2: The Risk Matrix

An alternate method to identify the risks and controls of a given process is to allow users to add the details directly to the activities in IBM Blueworks Live. This is done by adding two custom fields – for the sake of this discussion we will call these fields “RCM Risk” and “RCM Control”. This is how many organizations currently capture risk/control details about a given Blueprint, even without the addition of Blueworks Insights. However, there are some potentially significant gaps in this approach. First, while this works very well when there is a single risk and single corresponding control to each activity, this is not always, or even often, the case. Many times, there will be many risks and many controls on a given activity – so how would you know which controls apply to which risks? Or, even more complicated, what if a control on one activity applies to a risk on a separate activity? This is where Blueworks Insights enters the picture.

Figure 4: Risk/Control Details Added to Blueprint in IBM Blueworks Live
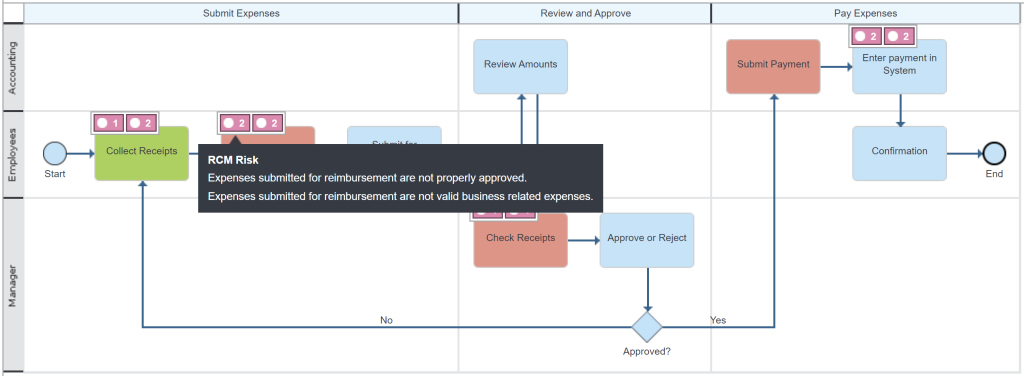
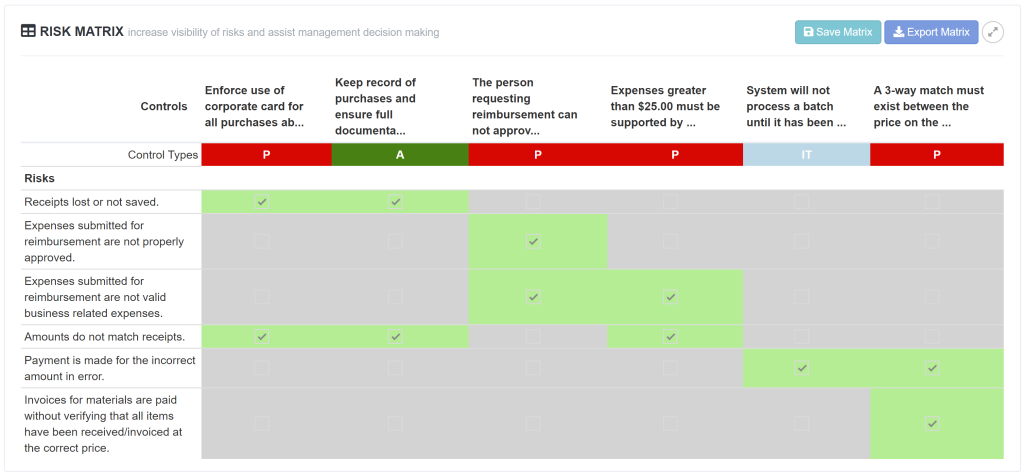
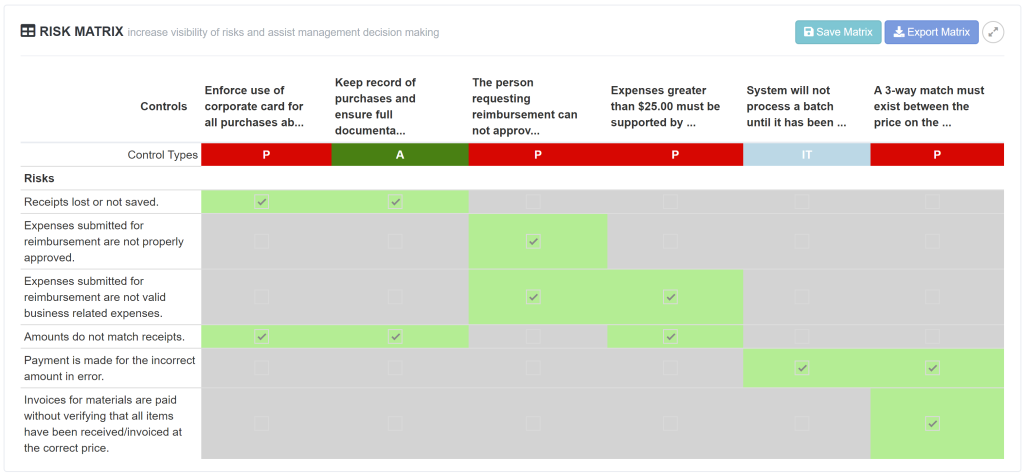
Once the risk and control details are added to the Blueprint in IBM Blueworks Live, users can log into Blueworks Insights and navigate to the Blueprint in order to add some additional detail.  Specifically, in the form of a “Risk Matrix” where the dependency between the risks and controls within the Blueprint can be established. This is currently provided through checkboxes that users can tick to identify where the risks and controls intersect, thus adding the last piece to the risk/control puzzle.

Figure 5: Risk/Control Matrix
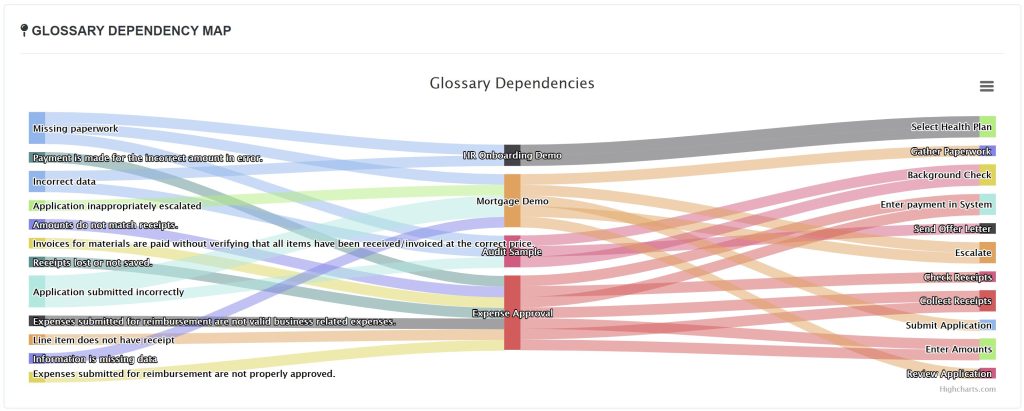
Capturing the risk/control information in IBM Blueworks Live provides us with additional capabilities as well. Since these entries are entered as Glossary values, we have access to the same reports and graphs provided for all Glossary terms in Blueworks Insights. These visualizations assist users in better understanding dependencies and connections and how these Glossary values are being used. The following chart shows how the risks (on the left) are connected to Blueprints (in the middle) and even down to individual activities (on the right). 

Figure 6: Risk/Control Dependency Diagram

Working with Governance, Risk and Compliance (GRC) Platforms

It is important to note that we are not attempting to make IBM Blueworks Live or Blueworks Insights into a GRC tool. The value of this approach is due to the core business processes that are discovered, diagramed and documented in the IBM platform. By linking risk/control details to those Blueprints we can better understand and evaluate exposures, mitigations, impact, and how those are tied to an organization’s business processes.

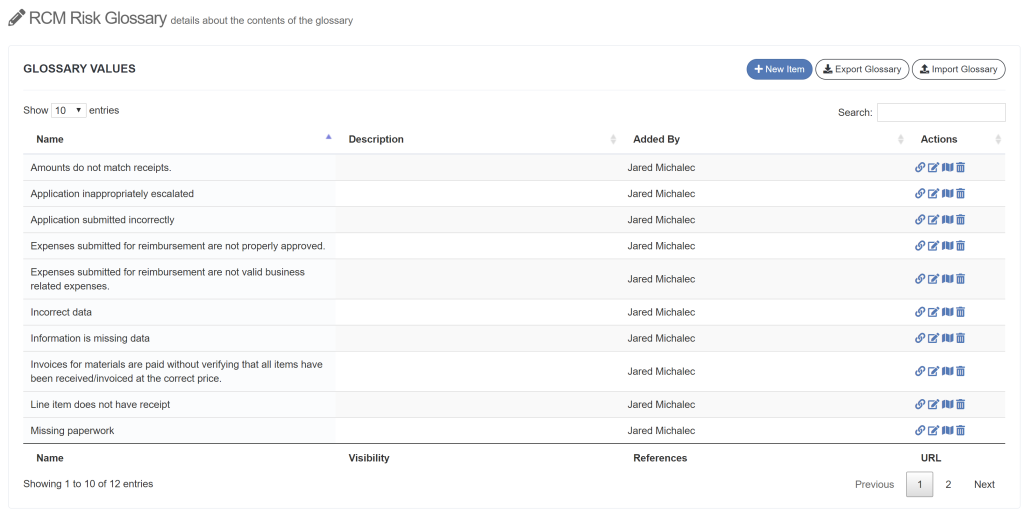
However, there are many cases where risk/control definitions and documentation already exist within an organization, typically stored in a GRC platform. This creates the potential for having two “sources of truth” of the risk/control information which could cause issues and conflicts. In these cases, we have given our clients the option to use Blueworks Insights as a “bridge” between the IBM Blueworks Live Glossary and the GRC repository. One method to do this is to periodically import the risk/control definitions using Insights’ Glossary Management module.

Figure 7: Glossary Management for Risks
Alternatively, in some cases we have directly integrated IBM Blueworks Live with the existing GRC tool. This integration basically synchronizes the information and surfaces any potential conflict for an administrator to resolve. Both approaches have their pros and cons, but we have effectively mitigated the “risk” of managing an organization’s risks and controls.

Summary

As with all the features in Blueworks Insights, we at Salient will continue to improve and expand the capabilities of the compliance and audit module. This development is largely dependent on how our clients are using the platform, and what additional details and resources would be beneficial to those clients. In addition, we are planning on frequent releases starting this month and will be introducing additional robust risk/control management and reporting features.

If you are interested in seeing a brief demonstration of the platform or to receive more information feel free to reach out to us at [email protected]. You can also register for a free trial of Blueworks Insights here. We continue to offer the platform for free to our Blueworks Live clients and only ask for feedback on how we can make the experience better for you. I look forward to hearing from you!


Let’s Chat!

START YOUR Digital Business Automation JOURNEY TODAY!

Contact VP of Client Services, Jared Michalec to learn more


RELATED CONTENT
More on Digital Business Automation:
More on Salient Process:

Salient Process is a full-service digital business automation shop and proud IBM Automation business partner. To learn more about us at our website, request a free consultation with one of our expert automation advisors! We look forward to guiding you and your company along your own unique Digital Business Automation journey.


 

STAY CONNECTED

👉Subscribe to Bots & Thoughts: The Digital Business Automation Podcast

👉Subscribe to our Spotify Here

👉Subscribe to our Apple Podcast

👉Subscribe to our Google Podcast Here


⏩Subscribe to Salient’s Monthly Newsletter Here 

🎤Be our next guest! Sign up Here

📲Contact our Podcast Host Here 


  ⏩LinkedIn

👉 Follow Bots & Thoughts on Here

👉 Follow Salient Process Here

👉 Follow our Podcast Host Here

  ⏩Youtube 

  ⏩Twitter 

🌐Learn more at Salient Process

How to improve your change management strategy 


Change Management: Everyone Hates Change. Everyone Loves Improvement.


Author: Geoffrey Hamm, Sr. Automation Advisor

 

Everyone hates change. Everyone loves improvement. Two statements that appear to be mutually exclusive. That’s because they are. The reality is people don’t like change, unless it’s irrefutably “better”.

You may have heard the term “Change Management” floating around the water cooler, understated, as if the phrase wasn’t worth the air used to muster it.

But what exactly is “Change Management”, and why is it always the last kid getting picked to play volleyball?


According to the American Society of Quality (ASQ):

Change management is defined as the methods and manners in which a company describes and implements change within both its internal and external processes. This includes preparing and supporting employees, establishing the necessary steps for change, and monitoring pre- and post-change activities to ensure successful implementation.

At this point in my career I’ve been involved in several software projects. Some have succeeded, some have failed. The number one culprit for failed projects is a lack of proper change management, yet organizations repeatedly make it an afterthought.

“They’ll do what we tell them to do”

“Leave adoption to us, that’s just change management”

As it turns out, companies will spend a ton of money building applications that never get used. 

Have you ever been driving out in the middle of nowhere, passed a sign for a new, sprawling subdivision and thought to yourself “who would ever live here?” A few miles later, as you pass the advertised subdivision, the answer is crystal clear: nobody would, and nobody does.

This also happens with software. And sure, you could impose a corporate-wide mandate (i.e. use it or lose… your job), but that’s a pretty hostile card to play. Regarding the adoption of a prospective solution I once heard a C level resource say, “I’ll jam it down their throats, and if they don’t like it, there’s the door”. Yikes!

What can we do to make sure it never comes to that?

Today I’m going to talk about a few specific things we can do to manage change with minimal effort, resulting in a dramatically higher success rate. By designing to the users, challenging everything, telling the story, taking a proactive approach to user acceptance, not walking away early, and a little hand holding, we can guide the highly subjective outcome of change from “worse” to “better”.

 

Design to the users

If I was designing a new hammer, I’d at least want to know what worked and what didn’t work with the old hammer. An easy way to get that information? Talk to someone who uses a hammer all day long.

This seems obvious, but it frequently doesn’t happen. Strategic overlords want to reverse engineer solutions from desired outcomes – metrics or KPIs. The “who” becomes secondary and is often written off as an issue for “Change Management” to address later. But to neglect our users is to neglect Change Management. Systems and data have no opinions on change; humans do.

Be aware of desired outcomes, but design to the users.

In 1980, IDEO, the renegade design firm out of Palo Alto, was tasked with creating a new computer mouse for Apple. The desired outcome was a cheaper mouse. This project was a success and the mechanism designed has been recreated in nearly every mouse since. More on that story here.

Imagine, however, if that mouse had been created with no consideration for the human hand. It would be (a) cheaper and (b) in a landfill.

The goal is to make it so good that people want to use it.

Challenge everything

Challenge everything. Nothing is off limits. 

Ask “why?” five times in a row (if you can do so without being annoying). 

Ask the “Harry Potter” question: “If you had a magic wand and could change anything in your organization, what would it be?”

Process improvement should be an opportunity, not an obligation.

Trust is a prerequisite. If the participants think these changes are purely hypothetical and unlikely to materialize, they will be unlikely to subscribe to the paradigm shift. This is where the “Art of the Possible” plays a key role, because it’s not just about thinking outside the “box”, it’s realizing that what’s outside the “box”, albeit foreign, still exists in nature.

The sad reality is that a lot of people have been burned by the promise of technology, resulting in wide-spread skepticism. As a result, it takes some people a while to warm up to the principles of agile software development. They fear that if they don’t disclose every single nuance up front – covering all bases, dotting all i’s, crossing all t’s – that it will very soon be too late.

Today, technology can change as rapidly and as fluidly as our conversations about it, but that adaptability is useless if there is nothing to adapt it to (i.e. no conversation being had). So, to make everyone comfortable, mitigate fear and encourage conversations, just break it down:

When challenging everything, don’t just say “we can…”, but also say “…and here’s how we could” (possibly even “this is how long it might take).

Once all parties (including the system) trust one another, and we have successfully fostered a “challenge everything” environment in which everyone is openly contributing, challenging our competitors will just be another thing.

Tell the story

Don’t just talk to your users at the beginning and end of a software engagement, keep them involved every step of the way. Everyone loves a good story. Even more, everyone loves to feel like they’re a part of a good story

Like most good books, we want to focus on our characters and their development. More specifically, we want to focus on our characters (End Users) and the actions they take to achieve a result or outcome. Our beloved characters must always prevail!

Like books, projects have chapters (Iterations) with a beginning paragraph (Sprint Planning) and an ending paragraph (Playback). Over the course of the chapter, things change. Have you ever found yourself reading a book, briefly zoning out, then realizing your comprehension dropped off a few pages ago? This happens in software engagements too, which is why we recap with a Playback. 

Blank page. New chapter.

Hold their hands

If you can’t explain it to a middle schooler, you probably don’t know what you’re talking about. An age-old adage. If you think it’s a hyperbolic one, it isn’t – just watch Dr. Talia Gershon explain Quantum Computing to an 8 year old. Hand holding is important. This is the reason I am so anti-acronym, as you may have discerned from my previous articles. Acronyms isolate those unfamiliar with them. 

Make it so simple that it’s understood by the least common denominator, and don’t omit the value proposition. The value of the new system should be universally understood. This is the definition of everyone being “on the same page”.

Much like a parent teaching a child to ride a bike, at some point we’ve got to let them go. They may fall. They almost always fall. But over time, the child will ride like the wind!

My point – you can’t hold the end user’s hand forever, which is why it’s important to let them drive. We always prefer Playbacks to be delivered by the End Users, because (a) it gives us an opportunity to regain some objectivity, (b) the message is always stronger when delivered by someone close to you and (c) we can see what happens when we take our hands off. 

Take a proactive approach to user acceptance

There’s no reason to get everything 100% complete before asking our users if they like – accept – it. 

When I first started at IBM, we had a Bootcamp. The general function was to input a group of fresh-faced college kids, and output a group of capable, self-reliant software consultants… or so I thought.

During Bootcamp we’d get very hard (often impossible) assignments and the expectation was for us to find our own answers and to present whatever sort of self-sourced solution we could scrap together. There was a kid in my class however who was notorious for asking questions. Meanwhile, I kept my questions to a minimum, thinking I would learn more by making it harder on myself – I’d have more to show for it. But every day around 5 or 6, my co-worker would have completed his work and be out the door, while I would stay late, clinging to the linings of a Keurig cup.

Did this make me a better consultant? No. Arguably worse. In the real world, nobody cares how you got the answer, only that you got it. I would argue that my co-worker was developing better skills by uncovering solutions quicker, making better use of available resources, often leaning heavily on soft skills to do so. He also was getting a lot more sleep.

User acceptance is the same way. If we want to be popular, we can’t just be quiet all year and then rock everyone’s socks off in the annual talent show. Napoleon Dynamite is the exception.

If we want to be accepted, we need to be proactive and talk to people – ask questions, let them know that we’re human too, and that we’re capable of listening.

Don’t disengage until it’s on Autopilot

At some point, our work will be done. What a great feeling! We can exhale and look forward to life’s next challenge. Too often, we think we’re done when we aren’t. We’re setting the baton on a desolate strip of highway with no fellow runners in sight – it’s not on “Autopilot”.
I am not saying we should make ourselves irreplaceable (or move in), but rather that we should plan to be replaced responsibly. We should define what “Autopilot”, or a successful handoff, looks like because it varies from project to project. “Autopilot” might mean that we’re running in Production with 100+ instances. Other times, it might mean that the in-house development team is successfully building greenfield applications for their fellow users. Either way, we should define it and work towards it.

The harsh reality is that – if we disengage too early – the project will often crash, or fly straight on to the shelf.


Change Management is a very complicated, nuanced discipline. By no means have I fully explained it over the course of this article, but hopefully I have helped convey its importance. For Salient, Change Management is not just an afterthought – it’s omnipresent. By taking some of the steps outlined above, we can increase the adoption of our applications.

We’re like the news, we have a story and we need to spin it from “everyone hates change” to “everyone loves improvement”.


Let’s Chat!

START YOUR Digital Business Automation JOURNEY TODAY

CONTACT SR. AUTOMATION ADVISOR, GEOFFREY HAMM HERE TO learn more


MORE ON Digital Business Automation:
MORE ON SALIENT PROCESS:

Salient Process is a full-service digital business automation shop and proud IBM Automation business partner. To learn more about us at our website, request a free consultation with one of our expert automation advisors! We look forward to guiding you and your company along your own unique Digital Business Automation journey.


STAY CONNECTED

👉Subscribe to Bots & Thoughts: The Digital Business Automation Podcast

👉Subscribe to our Spotify Here

👉Subscribe to our Apple Podcast

👉Subscribe to our Google Podcast Here


⏩Subscribe to Salient’s Monthly Newsletter Here 

🎤Be our next guest! Sign up Here

📲Contact our Podcast Host Here 


  ⏩LinkedIn

👉 Follow Bots & Thoughts on Here

👉 Follow Salient Process Here

👉 Follow our Podcast Host Here

  ⏩Youtube 

  ⏩Twitter 

🌐Learn more at Salient Process

What is Blueworks Insights?

Bringing IBM Blueworks Live to Life


Author: Jared Michalec, VP of Client Services


Background

Blueworks Live from IBM is a very powerful yet intuitive platform that is used by businesses, large and small, around the globe. If you have not tried it, I highly recommend taking a look – you can even sign up for a 30-day free trial here.

Its main focus is to enable organizations to discover, model and document their core business processes in a centralized, standard way. We often refer to it as “Visio on steroids” but really it is about adding business- and process-specific metrics and measurements to what you would traditionally capture in drawings. Whether you are a new user, or very experienced, there are a variety of resources for you to tap into including: user groups, monthly “Ninja” sessions, and much more.

I have been using Blueworks Live since 2009 when IBM acquired the company Lombardi, and with it the platforms we now know as Blueworks Live, as well as Business Automation Workflow (formerly Business Process Manager, and before that Lombardi Teamworks). I was at IBM during this time and being on the Worldwide Technical team. I helped with the acquisition transition and training of IBMers on these new capabilities. Since then we have seen Blueworks Live take over the process modeling world and become the standard platform for many process excellence initiatives.

Throughout my time at IBM, and now with my current company Salient Process, I have worked with countless customers who need additional reporting and visibility to the data they have captured in Blueworks Live. Early on, IBM provided access to this information via the supported REST API; so with a bit of development, we were able to surface a lot of valuable information.

The Origin of Insights

While delivering a one-off solution via a consulting engagement did provide value to clients one project at a time, we determined there had to be a better way. This is how the Blueworks Insights platform was born. The developers at Salient Process pooled their knowledge and experience, as well as the input from all those customer engagements and discussions, and centralized it into a standalone solution that we initially provided to our larger Blueworks Live clients. While it started off somewhat modestly, the feedback we received over the first 6 months contributed to incredible growth, and it went from a simple reporting tool to a true extension to Blueworks Live and continues to grow with each release.

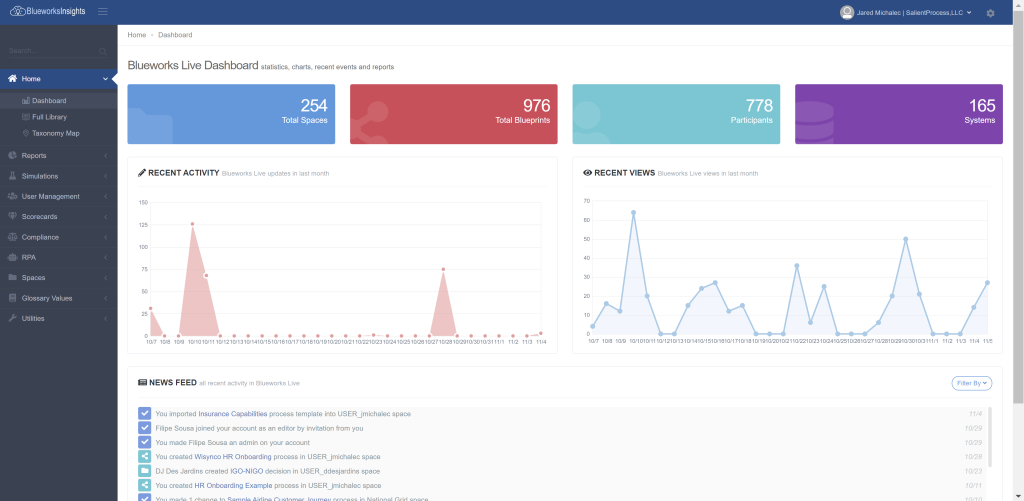
Figure 1: Blueworks Insights Dashboard

Blueworks Insights not only enhances the experience of the platform, but truly expands it with additional capabilities and broadens the user base to those that were not willing or able to use the IBM solution previously. The following are some of the features and functions that the tool provides to users of Blueworks Live.

Reporting and Analytics

Historically, the low-hanging fruit for pulling the critical business data to the surface was in the form of dashboards and reports. We compiled the most commonly requested reports from previous and current clients and provide those dashboards automatically through the Insights platform. These reports include:

  • Blueprint Updates and Views
  • “Stale” Blueprints
  • User Activity
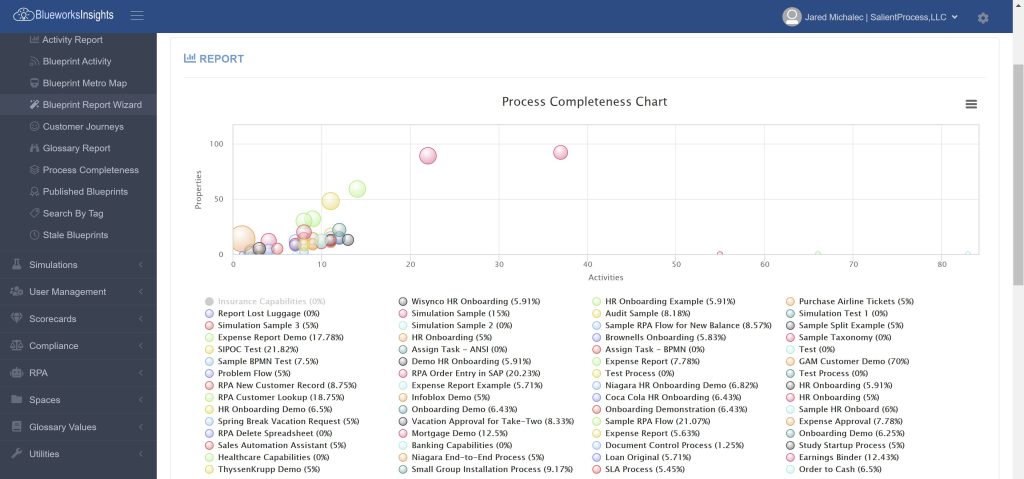
  • Process Completeness
  • Published Blueprints

Figure 2: Process Completeness Report

User Management

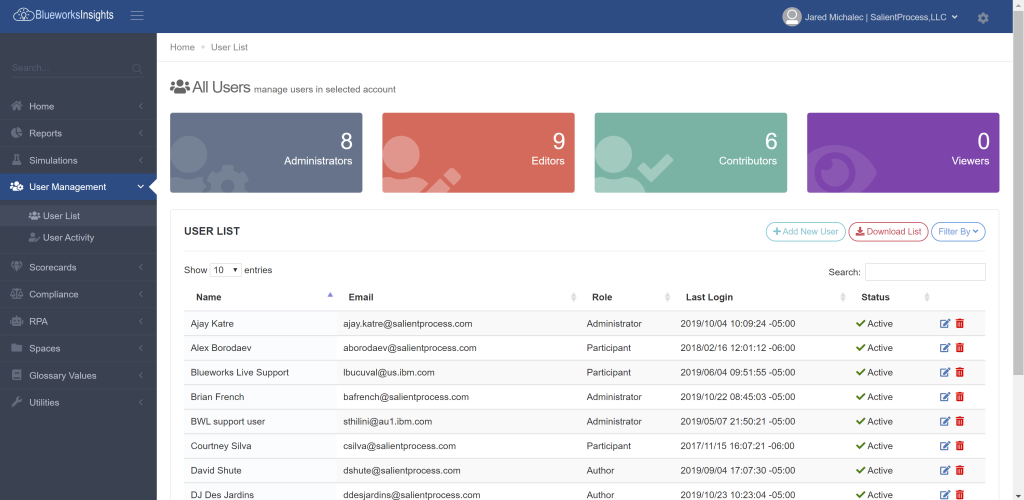
Blueworks Live does a good job at viewing basic information about users and makes it easy to onboard new ones. However, there are times when administrators want to provide their users with a more consistent onboarding experience. This can include links to documentation, videos and specific governance Spaces in Blueworks Live itself in order to enable those new users much more quickly. In addition, today administrators of Blueworks Live need to log in and monitor user logins to determine which users are not using the tool. Using Insights, administrators can establish automated reminders when a user has not logged on within a period of time, and even automatically de-provision a user if they have not used Blueworks Live for an extended time (i.e. 3 months). 

Figure 3: User Management Dashboard

Process Scorecards

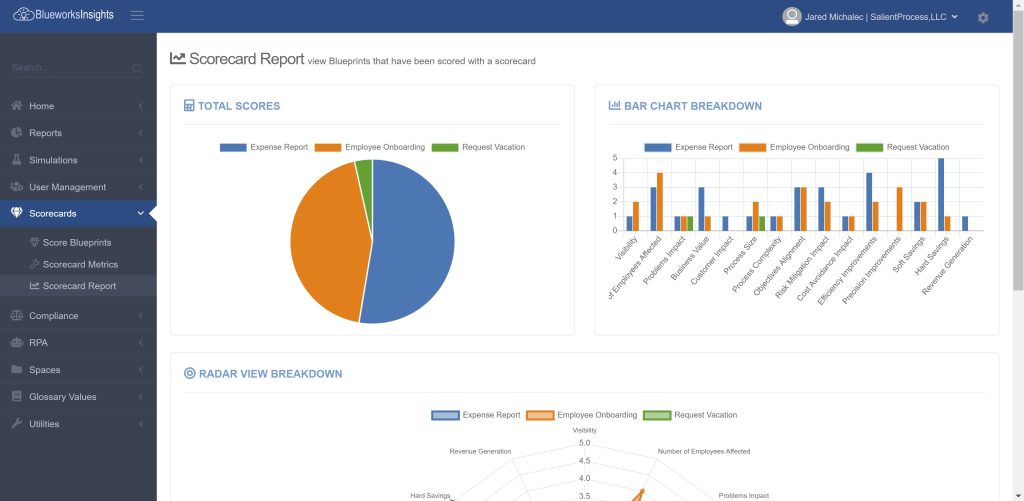
While Blueworks Live does a great job of allowing users to capture properties and measurements of the Activities of a Blueprint, there is not a way to capture data about the Blueprint itself. In Insights, users can add additional, customized metrics in order to “score” or “prioritize” the Blueprints. These metrics can include more subjective measurements such as “Visibility” or “Impact to the Customer”. Further, this also enables users to do something that is difficult to do in Blueworks Live: compare metrics across multiple Blueprints. Users can identify key opportunities and prioritize Blueprints for potential process improvements or even for automation projects.

Figure 4: Process Scorecard Report

Risks and Controls

Expanding on the concept of Scorecards, Insights also provides users the ability to capture specific compliance or audit measurements and metadata on the Blueprints or Activities in the form of Risks and Controls. Users can then associate the Risks and Controls into a dependency matrix to better understand the mitigation, impact and exposure of the documented Risks.

Figure 5: Risk and Control Matrix

Taxonomy, Value Streams and Capability Maps (oh my!)

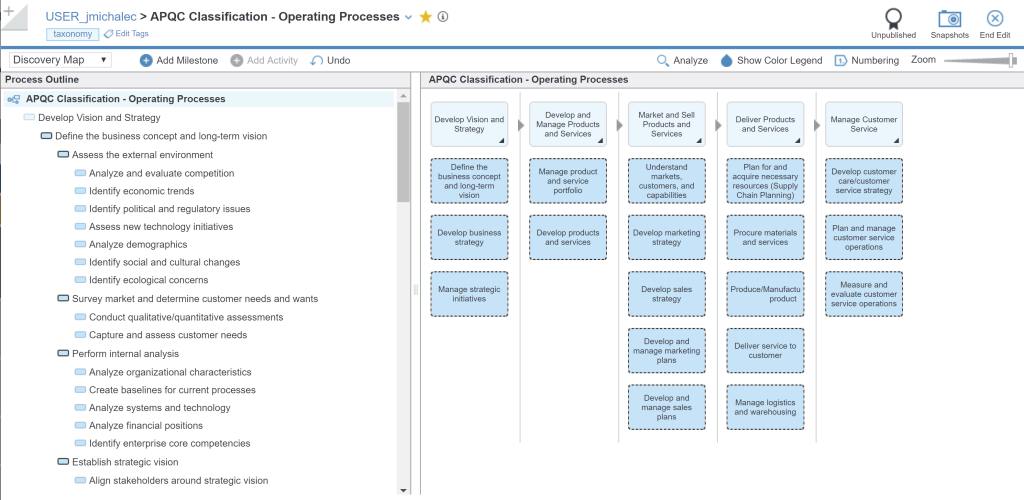
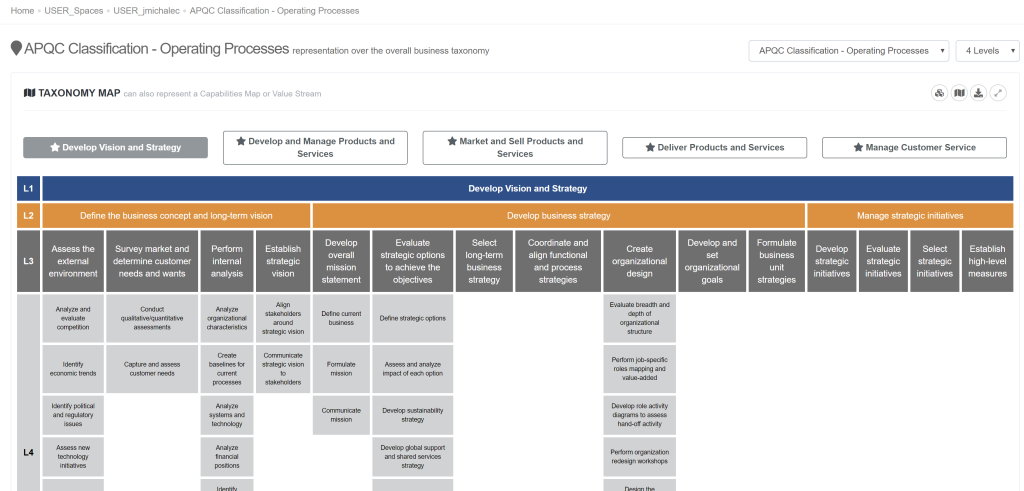
Over the years, I have worked with many Lean Six Sigma teams and other process improvement groups on their adoption of Blueworks Live. One of the limitations we run into consistently is how to capture the process hierarchy and follow standard principals such as APQC. Traditionally, the most common approach to creating these process structures was via Spaces, treating them like folders and sub-folders to create the hierarchy. However, the conflict that often comes up is that Spaces are also the way to manage user access, so administrators and process leaders are forced to choose between a structured hierarchy, and more granular control of users and groups. With some of the new functionality in Insights, these process hierarchies can now be captured in a single Discovery Map. This provides two important capabilities. First, Insights can now provide alternate visualizations of the Discovery Map so that it looks much more like a process hierarchy or value stream. Second, within the Discovery Map, users can link the core process (such as at the L4 level) to the actual Blueprint – this way, the actual location of the Blueprint does not matter so Spaces can go back to being more project-specific and can be utilized to manage user roles and responsibilities. 

Figure 6A: APQC Process Framework Discovery Map in Blueworks Live

Figure 6B: Same APQC Process Framework Blueprint in Blueworks Insights

Discovery Map Visualization

Building on the theme of changing the visual of the Discovery Map, Insights now allows for the visualization of new charts and diagrams without needing to input anything more than what is being captured in Blueworks Live. 

  • SIPOC and RACI
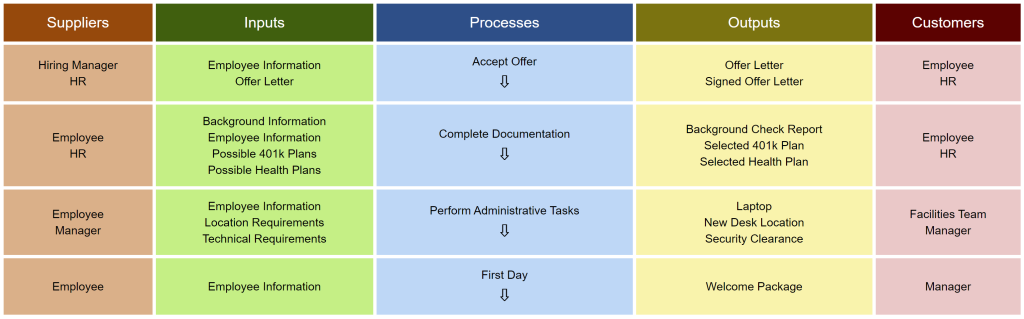
    • Some of the standard properties that can be captured in Blueworks Live are: Suppliers, Inputs, Outputs and Customers. However, there is no way to view this in a true “SIPOC Diagram”. Similarly, the information needed to display a RACI (Responsible, Accountable, Consulted, Informed) Chart can be collected in Blueworks Live, but there is not a way to display that information in a dependency chart. Insights provides an alternate view that automatically pulls those values to the surface in a more robust chart.

Figure 7: SIPOC Diagram

  • Customer Journey Map
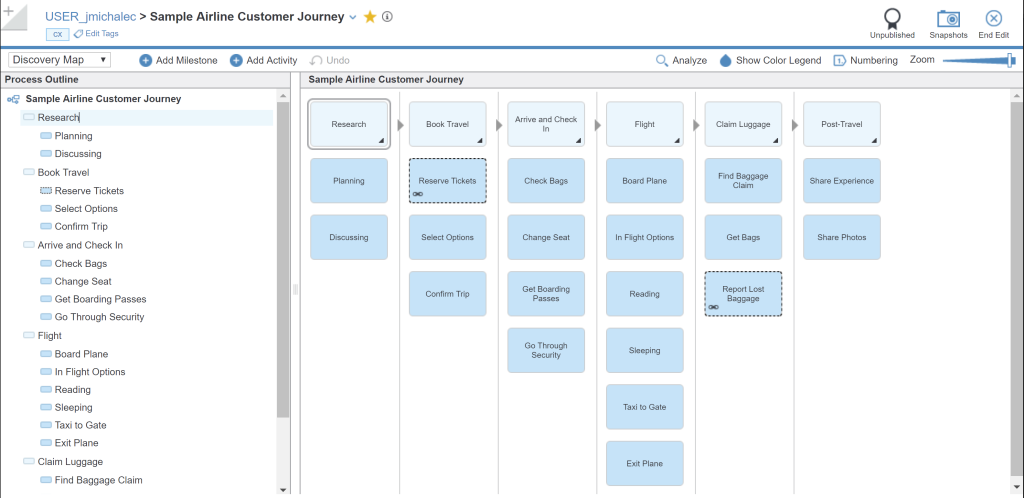
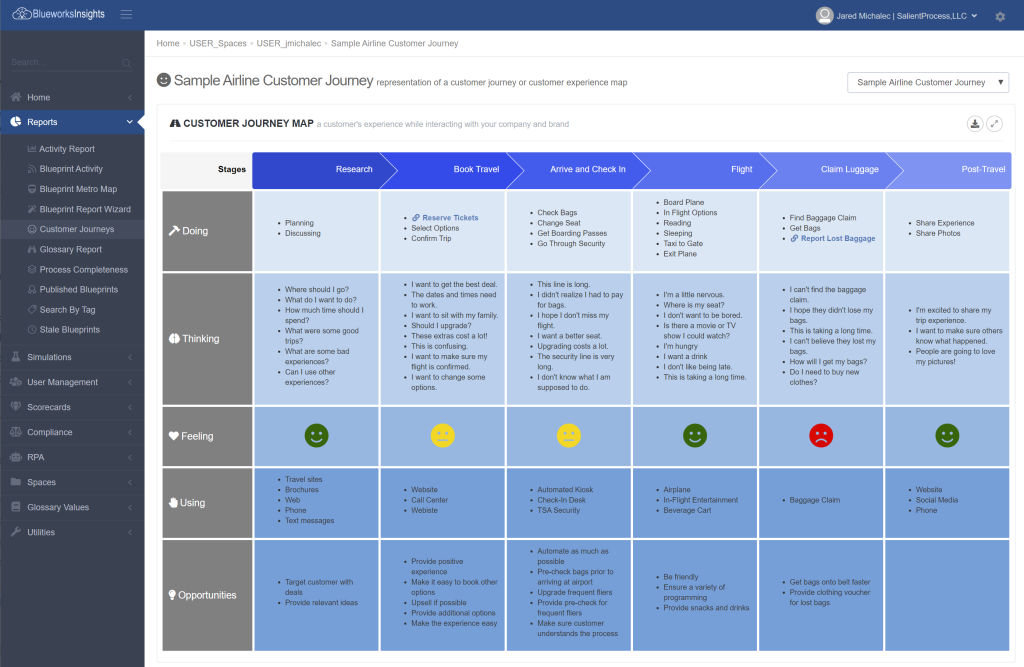
    • The Discovery Map in Blueworks Live has some of the basic components for a Customer Journey or Empathy Map (Milestones for Stages, Activities for the “Doing” Steps, etc.) but does not quite stand up visually. By introducing a couple custom fields in Blueworks Live, the Customer Journey can be documented and then displayed in Blueworks Insights how we would expect the diagram to look.

Figure 8A: Customer Journey Map as Discovery Map in Blueworks Live

Figure 8B: Same Customer Journey Map in Blueworks Insights

Glossary Management

One of the most powerful features of Blueworks Live is the Glossary. This includes the ability to not only capture the metrics and measurements on the Blueprint and Activities, but to also maintain the dependencies from those metrics back to the related Blueprints. However, it is not always easy to surface and visualize those dependencies. Insights gives additional reports and charts to show how the various metrics are related.

Figure 9: Glossary Dependency Report

In addition to the new reporting abilities, Insights can also act as a “bridge” between core applications within a business and Blueworks Live. This way the business application remains the source of truth and it is no longer necessary to manually sync between the two systems.

Simulation

I cannot count the number of times I have been asked by clients about being able to simulate the process models they have captured in Blueworks Live. In most cases they are not looking for highly sophisticated scenarios with multiple variations and algorithms, rather just to run some data through the models and see some of the results. This got us thinking about what we could provide in Blueworks Insights and if we could add just a couple configurable assumptions, then we could start to see some interesting results. The two inputs we needed to add in order to start simulating were: 1) Volume through the process (i.e. number of times a process starts in a day), and 2) Percentage of each exclusive gateway branch (i.e. how often something is approved). Once we added those variables, we were able to create an engine to quickly simulate data through a process and view the results, both at the Activity level, as well as for the overall Blueprint. This can also identify bottlenecks and rework loops with little or no input needed from the user.

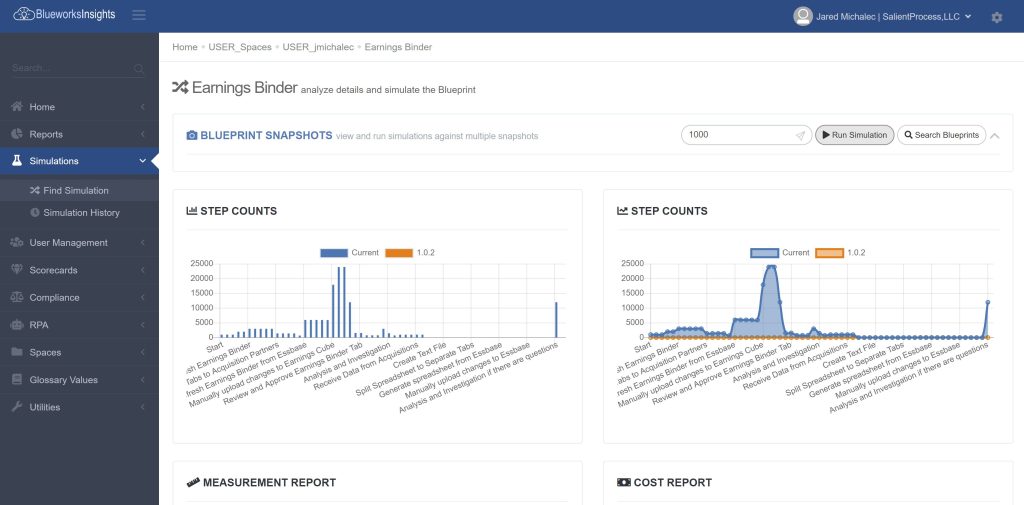
Figure 10: Simulation Results View

The current capability Insights offers in this area is only the beginning. There are many other dials and knobs we can add, and a lot more details and understanding to expose. In addition, because much of this can be captured and processed automatically without the need for direct user involvement, this would enable the platform to automatically highlight new opportunities for improvement and automation.

What’s Next?

With the success that Blueworks Insights has had with our current user base, you can understand why our backlog of requests continues to grow. We prioritize each of these and are delivering new functionality on a monthly, if not weekly basis. Where we see one of the larger opportunities is in the area of quantifying the value of process improvement and overlaying that with the effort it would require to implement. This could help organizations justify and prioritize projects, specifically in the area of automation. Users will be able to use IBM Blueworks Live to collect the critical business data and use Insights to automatically identify not only process or workflow opportunities, but also automation in the form of business rules, robotic process, document capture and content storage. As an IBM partner, we are very excited that this corresponds directly to the platform strategy that the IBM Cloud Pak for Automation offers. In this way, Blueworks Insights can help Blueworks Live deliver on the promise of more holistic, strategic process excellence, and truly be the entry point for end-to-end Digital Business Automation initiatives.

Summary

We at Salient Process are very excited by the success we have already achieved with the platform, and the incredible support from IBM and our clients throughout this journey. If you are interested in seeing a brief demonstration of the platform or to receive more information feel free to reach out to us at [email protected]. You can also register for a free trial of Blueworks Insights here. We continue to offer the platform for free to our Blueworks Live clients and only ask for feedback on how we can make the experience better for you. I look forward to hearing from you!


Let’s Chat!

START YOUR Digital Business Automation JOURNEY TODAY!

Contact VP of Client Services, Jared Michalec to learn more


RELATED CONTENT
More on Digital Business Automation:
More on Salient Process:

Salient Process is a full-service digital business automation shop and proud IBM Automation business partner. To learn more about us at our website, request a free consultation with one of our expert automation advisors! We look forward to guiding you and your company along your own unique Digital Business Automation journey.


STAY CONNECTED

👉Subscribe to Bots & Thoughts: The Digital Business Automation Podcast

👉Subscribe to our Spotify Here

👉Subscribe to our Apple Podcast 

👉Subscribe to our Google Podcast Here


⏩Subscribe to Salient’s Monthly Newsletter Here 

🎤Be our next guest! Sign up Here

📲Contact our Podcast Host Here 


  ⏩LinkedIn

👉 Follow Bots & Thoughts on Here

👉 Follow Salient Process Here

👉 Follow our Podcast Host Here

  ⏩Youtube 

  ⏩Twitter 

🌐Learn more at Salient Process

The Client

A large multinational manufacturer of Physical Facilities Equipment and Controls

Business Challenge

Is is very common for workflow applications to use approaches, and rely on dependencies that tie them down to their on-premise environment. There are management, security, environmental, and platform differences that require significantly more than just relocating code to a different server environment.

This was certainly the case for this customer, who, over several years of outsources and intensely collaborative development, had also acquired substantial technical debt in the form of maintenance complexity, inconsistencies, reliance on outdated tools and approaches, as well as an unmanageable number of project tracks and toolkit versions – all actively used and overlapping in the solution tree. (The solution tree represents all the apps in the solution, the toolkits they use, the toolkits all those other toolkits use, and so forth – this customer’s apps had 8 layers of dependencies on average).

Last but not least, was the need to plan a transition that minimized risk, contained complexity, manage the timeline, created minimal business disruption and addressed key security management differences between on-premise and on-cloud operating environments.

The Solution

The solution first entailed moving as little of the on-prem technical debt to the cloud as possible. However, because doing this comprehensively would have required examining and making manual changes to potentially thousands of artifacts, Salient Process instead turned to its own automated workflow application analysis, modification and generation tooling.

Leveraging the tooling was a game changer for the migration, greatly reducing the number of hours necessary for migration, largely eliminating the potential for human oversight and error, accelerating detection and changes, and only signaling the need for manual intervention when greater context and human intelligence were required.

Another key to the solution’s success was the ability to merge project tracks for toolkits that (because of expediency and due to limited reconciliation options on the BPM platform) were allowed to diverge over several years without the meaningful prospect of converging back. This effort was also significantly enhanced by the Salient workflow analysis tooling, which helped point out meaningful artifact differences sometimes across as many as 11 tracks for a single toolkit.

Lastly, overarching the entire effort, was a dependency tree-aware migration plan for toolkit and applications. This allowed the migration team to implement a low to no rework conversion sequence and allowed getting the customer’s solution back to a normalized state for toolkit snapshot and tracks used across the entire solution’s dependency tree.

Salient Results

The migrated solution now runs on a cloud-hosted infrastructure that provably delivers on the benefits of an environment fully managed by IBM. Those key benefits include customer relief of platform administrative responsibilities and incredibly fast turnaround for delivery of product updates and patches.

The combined benefits of a significant reduction in the number of tracks, normalization of dependencies and the overall solution also allowed the customer to pay off a significant portion of the existing technical debt (at a fraction of the anticipated effort, through Salient’s migration automation tooling). Also, due to Salient’s migration tools, we were able to save the client at least 75% of the time it would have taken to manually do the migration analysis.

The Client

A National Retailer and Distribution Brokerage Firm

Business Challenge

It was apparent that having a valuable resource spending about 25 hours a week simply transferring data from one site to individual spreadsheets, and then sending specific request to multiple vendors was not the best use of their time. This allowed very little time for that resource to focus efforts on scaling their business.

In addition, the mind-numbing and repetitive work the client was performing was a potential source of a large liability, introducing potential errors with such a manual process. It is very common for a human to insert the correct data into the wrong field and have no awareness of the mistake until problems arise, and by then it is too late.

Furthermore, the timing of when the required data was needed to be pulled from vendor sites was not during normal working hours. So, in addition to the hardship for the resource, it limited the hours the resource was available during the normal workday to meet with potential clients or handle daily business operations.

So how do we fix this problem?

The Solution

Salient Process knew immediately that this was a great use case for Task Automation (RPA). Very often RPA is used in combination with human and system activity, but in this case Salient was able to completely automate the tasks using standard RPA product features.

Salient was able to program an RPA “bot” to complete the following activities:

  • Log onto the client reporting system.
  • Extrapolate the required data for a particular vendor .
  • Place that data into the appropriate reporting format.
  • Email generated reports to the appropriate client and broker contacts.

This work is now 100% automated using RPA.

The Result

When Salient started the discovery conversations with this client, the client’s goal was to find a way Salient could help to automate some of the redundant work and allow them more time to scale their business. Salient was able to automate 100% of this activity, giving them back approximately 1,300 man hours a year, greatly reducing human error, allowing the client to be available to scale his business during the normal work day and produce a better report to his clients in a faster and more reliable fashion.

Not all human tasks are capable of automation, which is a good thing, but when you can use automation to free up the time of a valuable human resource, and actually produce meaningful work and help grow your business, don’t you owe it to your workforce to at least look into the options?

Reach out to Salient Process today to start a conversation and discover options where automation can free up your workforce to focus on the items that provide the most value for them and your company.

The Client

A Fortune 1000 Insurance Company

Business Challenge

As with most software, the consumer is subject to updates, new versions and eventually deprecation. The latter was the case for the version of IBM Business Process Manager our client was using; thus, the client needed to upgrade to the latest version: IBM Business Automation Workflow. The new version, with new features and functionality, provided the client a great opportunity to modernize along with the upgrade. It would seem silly to go through the pains of an upgrade and not take advantage of the new capabilities.

However, with approximately 250 process applications to migrate, and with a dire need for modernization, it wasn’t going to be a simple operation. So, we conducted a thorough discovery session with the client to find the best approach, as we knew simply throwing bodies at the problem wasn’t going to cover it. We agreed the “work smarter, not harder” approach would be best for this effort.

The Solution

Now that we agree on the “Work Smarter” approach, it is time to look for the areas we know we can save our client’s money. Salient Process has developed some industry-leading toolkits, templates and accelerators that we can leverage to help automate some areas of development. If development time per application can be reduced by 10 hours, we would in this case, be saving approximately 2500 development hours which we use to provide value in other areas, such as modernization of applications, training in best practices or new functionality. In this case we knew we would not be migrating 250 process applications overnight, so we worked with the client on an iterative strategy. So where do we start?

250 Birds, One Stone

As is the case with any project focused on increased reuse and modularity, taking inventory is a critical first step. Seven services that all do the same thing (or slight variations), for example, is in direct conflict with the modus operandi, and identifying all seven is the first step towards consolidation. This exercise prevented us from “reinventing the wheel”. The negative flipside of this is “paralysis by analysis”. By assembling the right team and relying on Salient Process’s extensive experience, we were able to chart a course after only a few weeks of due diligence.

Since we can’t migrate and modernize 250 processes overnight, we also had to formulate a strategy for rolling them out incrementally. We considered several options, but the one that made the most sense to the client was by business areas. This kept the communication more focused during the delivery periods. It also resulted in more narrow deployments for end users. This proved to be a very manageable, yet efficient, approach for the client.

In terms of reusability, we found some patterns that were prevalent across many (if not all) of their applications. This was great news as it meant we could begin to harvest assets. In the Lombardi coaches (now deprecated), this had not been possible. Meaning that if something was used in 500 places and it needed to change, 500 individual updates would be required. By using coach  views, reusable  services  and toolkits, we were able to not only cut development to a fraction of the original time, Dut the output was also a lot easier to maintain.

One reusable component of note was our Template coach view. This was a coach view that wrapped every client-side human service. It offered the developer a suite of reusable services including common Dutton events and validation and error handling frameworks — all as configuration options.

This Template accomplished several things:

  • It reduced technical Darriers so that Dusiness users were more enabled (more developers)
  • It cut coach development time by 50-90% (less time)
  • It added consistency to both the front and back end of the human services (more best practices)
  • It gave us a single entry-point to push changes across all coaches at once (more maintainable)

Between the Template and various other reusable components, we were able to not only decrease the time it took to modernize in half, but also increase the developer count by lowering the barriers to entry for less technical resources. When you look at that cost savings, the two weeks of due diligence seems more than worth it.

Continuous improvement is a continuous process. Salient Process is still actively working with this client to progress the modernization initiative. Since the start of this project, we have rolled out three lines of business (approximately 30 process applications with another 30 expected by the end of next month). Bug fixes have been minimal since so much of the functionality is shared. And, although our job is far from done, we have already been able to accomplish something far more effective and far less cumbersome than simply throwing bodies at it.

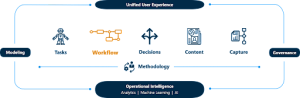
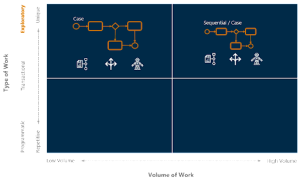
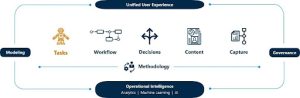
In Part 1 of this series on Automation Alignment, we described an overall approach to fitting the right type of automation to the type of work being done. We discussed the high level of looking at the type of work being done and matching Digital Business Automation (DBA) capabilities to that work. In Part 2 and Part 3, we discussed automated decisions and tasks, respectively, and the type of work they fit with. In Part 4, we’ll focus on the Workflow portion of DBA, indicated in Figure 1 in orange.

Workflow Automation has been around for years and comes in many flavors. Sometimes it is embedded in existing ERP applications such as SAP or Microsoft Dynamics. In these cases, the workflow is typically particular to the processes within that ERP suite and is not meant for highly custom workflows involving heterogeneous systems. Sometimes it is embedded in Enterprise Content Management tools such as Filenet. In the case of ECM, those workflows are meant for highly content-centric workflows, which we will discuss in a later blog in this series. And then there is the highly custom world of workflows which are entirely custom and meant for either Ad-hoc (Case) or Sequential workflows or a combination of both. This type of workflow automation should be used for the core processes at companies. In other words, the processes need to create differentiation for a company. That is about as far as we’ll go into the different types of workflow automation available. This is a vast subject and would require a full white paper or eBook to cover appropriately.

Salient Process is a firm believer well-designed processes and workflows are a fundamental part of making a business great. This should be pretty obvious from our name. However, the question we need to answer for you is when and how best to automate these workflows, which are a foundational part of your business. We feel a formulaic approach is best, although it is strictly a guideline. Management discretion should always be a part of any decisions regarding where best to use workflow automation.

If you read any of the other blogs in this series, you may want to skip to the next section since the following paragraphs are definitions repeated in each blog in the series.

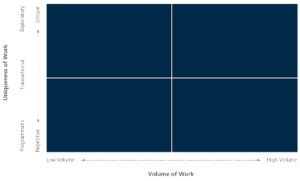
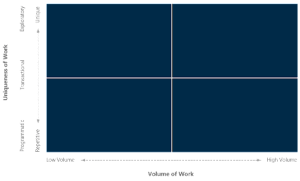
The way we approach making automation decisions is by leveraging an Automation Alignment Matrix (AAM). The Automation Alignment Matrix allows us to analyze the type of work being done and map that to the type of automation recommended.

Along the Y-axis, we measure the Uniqueness of Work being done, while the Volume of Work is measured along the X-axis. What we are attempting to do with this matrix is determine where an automation capability best fits into one of the four quadrants based on the type of work being done, with the type of work determined by its uniqueness and volume. There are other factors an organization should take into account, such as assessing the relationship between job performance and strategic value, which will help you determine the return on improved performance (ROIP). ROIP is a subject unto its own, which we may cover in another blog. For a deeper dive into ROIP, read Part 1 -> Step 2 of Reinventing Jobs by Ravin Jesuthasanand John Boudreau

Before we go too much further, some definitions seem appropriate. Low and High Volume (X-Axis), as well as Repetitive and Unique (Y-Axis), are self-explanatory. However, the Programmatic, Transactional, and Exploratory terms along the X-Axis are less self-explanatory. The definitions for Programmatic, Transactional, and Exploratory are from the MWD Advisor’s article mentioned earlier. These criteria were added to the X-Axis because we felt they added more depth to the matrix. Below are definitions for the three words needing more explanation (somewhat appropriately, the definitions for each of these get longer the less prescriptively the work can be defined up front):

  • Programmatic:  Almost all the features of the work can be prescribed and designed in detail in advance. It’s possible for the work to be almost entirely automated. 
  • Transactional:  Many of the tasks and decisions involved, and most of the flow of work, can be prescribed and designed in advance. However, human discretion and expertise are required to carry out some tasks, as well as in deciding when, how, and where work needs to be progressed. 
  • Exploratory:  The set and sequence of tasks and decisions needing to be performed, and the people or roles needing to perform them, are very unlikely to be decidable ahead of time. In exploratory work, the overall experience for both the work participants and the customer of the work is a set of possibilities being explored rather than a recipe being followed.

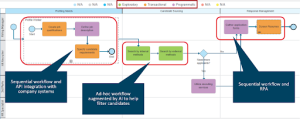
Now that we have these definitions, as we look across a company and begin trying to determine how and what to automate, we can look at things from a process and activity (task) perspective, and take a prescriptive approach to automation. When looking across a business process, it is quite common for all five types of automation capabilities in Digital Business Automation to be needed. However, the job of our Automation Alignment Matrix is to help us narrow down automation for specific types of work. We can also leverage a tool like IBM Blueworks Live to model out our processes and analyze what type of work is being done. This will prepare us to use the Automation Alignment Matrix since we’ll have classified the work as either Exploratory, Transactional, or Programmatic.

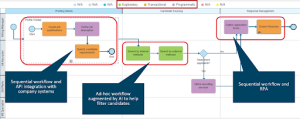
In figure 3, we have a purely fictional hiring process. We have color-coded the activities within the process to correlate with the different types of work (i.e. Exploratory, Transactional, and Programmatic). By leveraging this color coding in combination with the Automation Alignment Matrix, we have the starting point for prescriptive guidance in determining where to leverage different types of automation.

Our objective in this blog is to look at Workflow Automation in the context of all three types of work.

Programmatic:

Given Programmatic work is defined as work that can be prescribed and designed in detail in advance, and the w

ork can be almost entirely automated, Workflow is typically not the best fit here. This type 

of work generally is best for Unattended RPA, Integration through APIs, Intelligent Data Capture,

and Decision Management. Usually, Programmatic work ends up getting leveraged downstream from Transactional and Exploratory work. In other words, the Programmatic work is a subset of work being done as part of a larger workflow or process. This is part of the analysis which needs to be done when looking at any business process. 

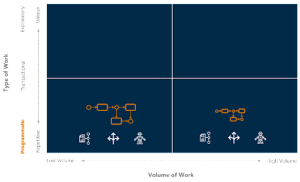
In Figure 4 we can see the Workflow icon represented in the quadrants corresponding with Programmatic work. What we’ve tried to represent with the Workflow icon, and the RPA, Decision, and Data Capture icons, is in the case of Programmatic work, Workflow is not typically the main player. It may orchestrate other Automation capabilities such as RPA, Decisions, and Data Capture, but it isn’t the main driver. However, in looking at High vs. Low Volume work, Workflow may end up playing a bigger role in Low Volume work just due to ROI considerations. In Low Volume Programmatic work, it may not be worth it for a company to automate Decisions, Tasks, and Data Capture. Or, maybe those automation capabilities are only partially introduced. In either case, you may end up with Workflow playing a bigger role by guiding people to the work they need to do, but the work ends up being manual.

Transactional:


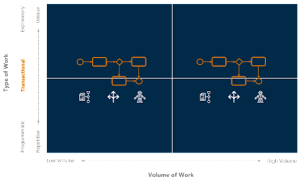
Transactional work is the sweet spot for Workflow Automation. Typically transactional work can at least be partially defined upfront, and usually requires a prescribed flow as well as defined roles to complete the work. This is where Workflow Automation can shine. Other automation technologies may take a back seat to Workflow when it comes to Transactional work, or at least the understanding is automation will be led by Workflow for this type of work.  Also, this Workflow is typically Sequential, rather than Ad-hoc or Dynamic in nature. Ad-hoc and Dynamic Workflow tend to be more relevant for Exploratory work, which we’ll discuss in the next section. However, this does not mean Transactional work cannot have Ad-hoc and Dynamic Workflows, it just means Sequential Workflow is more prevalent for this type of work.

Exploratory:


Exploratory work is, by definition, unpredictable. The very word explore brings to mind going off and doing exciting and unforeseeable things. Every company has a ton of exploratory work. This work is typically the highest value work done at a company. This area houses your knowledge workers, and we predict this is where automation will eventually drive all human workers to live. Applying prescribed automation to exploratory work becomes much more difficult than the other types of work, if not impossible. Think about the work your executive teams typically do. Mostly, it is making decisions and delegating work based on their experience and knowledge of the business. Trying to predict those decisions and actions through highly controlled Sequential Workflows would be a recipe for disaster.

However, where Workflow can play a role in Exploratory work is with Dynamic Case or Ad-Hoc Workflows. As we described in the previous paragraph Exploratory work is unpredictable and requires high levels of human discretion. However, there can be pre-defined tasks and smaller Workflows within Exploratory work. It is just that it is difficult to predict when these pre-defined tasks and smaller Workflows will be needed. That is why Exploratory work is an excellent fit for Dynamic Case or Ad-Hoc Workflows.

Tying it all Together

As we mentioned in the first paragraph of this blog, this is Part 4 of a series of blogs (Part 1; Part 2; Part 3) on taking a holistic approach to automation when leveraging Digital Business Automation. Hopefully, this blog will help you avoid what we see happening in some automation efforts; Workflow as a panacea for all things automation related. Workflow is outstanding in some situations, but you need an overall approach to automation which allows you to take a look at the big picture and determine what type of work you’re doing, and then what automation, if any, fits best with that work.

IBM Blueworks Live Review

It Has The Ability To Document In Different Formats And Is Not Tied To A Specific Model


Author: Jared Michalec, VP of Client Services


Below is an interview with Jared Michalec, Salient Process VP of Client Services, by IT Central Station. Click here to access the original copy of the interview.


What is our primary use case?

We are resellers. Our use case varies from client to client, but the most common are for initial demonstration, cut mapping, and workshops with the clients.
We are always looking for opportunities to expand. We work with clients, but we also look at our processes internally and where we could streamline some of those.

We are using the following tools from the IBM DBA portfolio: Blueworks Live, BAW (formally BPM), ODM, and RPA. We have implemented the IBM Automation Platform for Digital Business with our customers, but not internally.

How has it helped my organization?

We use automation in a few different areas. We have a number of internal (as well as external) processes; like

  1. expense reporting
  2. sales hand-off
  3. time tracking

which are all done in the IBM automation suite. In terms of direction, one of the things that we value in a tool is not just that we are getting a benefit from it, but can we apply that benefit to other client situations. One of the things that we look at when assessing if something is a candidate for automation is: “Is it repeatable, or is it something that we could bring to our customers?” This is definitely something that we consider when we are thinking about automation.

What is most valuable?

That it has the ability to document in different formats. It is not tied to a specific model. You can look at it from different angles and see the intuitive nature of it. It always generates a valid diagram. You cannot create something that is not BPMN compliant.
It is very usable. That is probably one of its biggest selling features – its ability to have someone sit down and spend a couple minutes on it, then they are off and running. 

What needs improvement?

In the past we have seen some projects not start on time. This is because we had some process gaps in our automation. By removing those and getting the right people involved at the right time, we were able to send notifications and make sure the information was in the right place. This has really helped to eliminate that risk.
We would like the ability to add additional custom colors. We would like to color additional items to add notes to the blueprint. We would like to see more robust API access. We want it to be able to interact not just through the front-end, and have the ability to integrate with other systems more easily.
The reporting and analytics features have room for improvement, as well as some of the management and governance. These should be done out-of-the-box, as opposed to being built manually.

What do I think about the stability of the solution?

The system is very stable if it is setup the right way.
The cloud versions that we use for customer-facing things are usually more resilient, as opposed to us standing something up internally. Sometimes we miss something, or something is not setup exactly right, but these are not product issues.

What do I think about the scalability of the solution?

It’s very scalable, either horizontally, adding more servers to the cluster, or vertically, where we are increasing the server size. It is pretty easy to keep up with demand and being able to spin things up and down.

How are customer service and technical support?

We don’t have a lot of interaction with technical support. In most cases we are the technical support since we have the background. For Blueworks, they are very responsive. 
Often we will either log tickets ourselves or log tickets on behalf of our customers. Then the Blueworks support team is very responsive and will get back to us right away.

If you previously used a different solution, which one did you use and why did you switch?

We try it ourselves before putting it in front of our customers.

How was the initial setup?

The initial setup is straightforward. For Blueworks, because it is cloud-based, they stand it up for you and provision it usually within 24 hours.

What was our ROI?

The solution has increased productivity and reduced operating costs (in soft costs). 
It saves time, probably a couple days a month, but this is dependent on the process. E.g., it reduces our onboarding from about five days to three days. Therefore, it saves us about 30 days over the course of a year. This is how it helps us from a business process management use case.
For automation projects, the ROI varies depending on the tools. The RPA capability definitely has the fasted ROI and lowest investment. However, we see a more significant ROI with some of the deeper automation tools, like BPM and ODM.

What’s my experience with pricing, setup cost and licensing?

Our licensing costs are very minimal because we get a lot of the solutions for free (as a partner).

Which other solutions did I evaluate?

We only work with IBM.

What other advice do I have?

Try it out. It is clear once you start using the solution that it is a different type of application. There is no direct competition to the tool.
I don’t think that there is another product out there quite like it. There are some competitors certainly, but they are either more complex, costly, or too simplistic and not geared towards process documentation.
The integration process is pretty open-ended. You need to be fairly technical to make it work, but we have seen success in integrating it with QuickBooks and Salesforce. Now we are looking at other systems to integrate it with, as well.
I learned the best approach to adopting process improvement across an organization from using this solution.

Disclosure: My company has a business relationship with this vendor other than being a customer: Reseller.


Let’s Chat!

START YOUR Digital Business Automation JOURNEY TODAY!

Contact VP of Client Services, Jared Michalec to learn more


RELATED CONTENT
More on Digital Business Automation:
More on Salient Process:

Salient Process is a full-service digital business automation shop and proud IBM Automation business partner. To learn more about us at our website, request a free consultation with one of our expert automation advisors! We look forward to guiding you and your company along your own unique Digital Business Automation journey.


STAY CONNECTED

👉Subscribe to Bots & Thoughts: The Digital Business Automation Podcast

👉Subscribe to our Spotify Here

👉Subscribe to our Apple Podcast

👉Subscribe to our Google Podcast Here


⏩Subscribe to Salient’s Monthly Newsletter Here 

🎤Be our next guest! Sign up Here

📲Contact our Podcast Host Here 


  ⏩LinkedIn

👉 Follow Bots & Thoughts on Here

👉 Follow Salient Process Here

👉 Follow our Podcast Host Here

  ⏩Youtube 

  ⏩Twitter 

🌐Learn more at Salient Process

In Part 1 of this series on automation alignment, we described an overall approach to fitting the right type of automation to the kind of work being done. We discussed the high level of looking at the type of work being done and fitting Digital Business Automation (DBA) capabilities to that work. In Part 2, we discussed automated decisions and the type of work they fit with. In this blog (Part 3), we’ll focus on the Task (RPA) portion of DBA, indicated in Figure 1 in orange.

Before we get into which types of work can be most helped by Task Automation, we need to point out our strong feelings on Task Automation, in particular, Robotic Process Automation (RPA). RPA is excellent when used correctly. That is, with a focus on automating mundane repeatable tasks. As we firmly stated in our RPA is Dead blog, we believe RPA is inappropriately named. It should be called Robotic Task Automation since RPA technologies cannot automate whole processes, only individual tasks within a process. We won’t cover this much deeper here since we gave the subject in-depth coverage in the RPA is Dead blog. 

For the rest of this blog, we will give a lot of focus to RPA since that is where the market is today, and is also what IBM means by Tasks within the context of their DBA platformHowever, there are other technologies which could be considered for Task Automation, and we will briefly touch on those as needed. 

If you read any of the other blogs in this series, you may want to skip to the next section since the following paragraphs are definitions repeated in each blog in the series.

The way we approach making automation decisions is by leveraging our Automation Alignment Matrix (AAM). The Automation Alignment Matrix allows us to analyze the type of work being done and map that to the type of automation recommended. 

Along the Y-axis, we measure the Uniqueness of Work being done, while the Volume of Work is measured along the X-axis. What we are attempting to do with this matrix is determine where an automation capability best fits into one of the four quadrants based on the type of work being done, with the type of work determined by its uniqueness and volume. There are other factors an organization should take into account, such as assessing the relationship between job performance and strategic value, which will help you determine the return on improved performance (ROIP). ROIP is a subject unto its own, which we may cover in another blog. For a deeper dive into ROIP, read Part 1 -> Step 2 of Reinventing Jobs by Ravin Jesuthasan and John Boudreau 

Before we go too much further, some definitions seem appropriate. Low and High Volume (X-Axis), as well as Repetitive and Unique (Y-Axis), are self-explanatory. However, the Programmatic, Transactional, and Exploratory terms along the X-Axis are less self-explanatory. The definitions for Programmatic, Transactional, and Exploratory are from the MWD Advisor’s article mentioned earlier. These criteria were added to the X-Axis because we felt they added more depth to the matrix. Below are definitions for the three words needing more explanation (somewhat appropriately, the definitions for each of these get longer the less prescriptively the work can be defined up front): 

  • Programmatic: Almost all the features of the work can be prescribed and designed in detail in advance. It’s possible for the work to be almost entirely automated.  
  • Transactional: Many of the tasks and decisions involved, and most of the flow of work, can be prescribed and designed in advance. However, human discretion and expertise are required to carry out some tasks, as well as in deciding when, how, and where work needs to be progressed.  
  • Exploratory: The set and sequence of tasks and decisions needing to be performed, and the people or roles needing to perform them, are very unlikely to be decidable ahead of time. In exploratory work, the overall experience for both the work participants and the customer of the work is a set of possibilities being explored rather than a recipe being followed 

Now that we have these definitions, as we look across a company and begin trying to determine how and what to automate, we can look at things from a process and activity (task) perspective, and take a prescriptive approach to automation. When looking across a business process, it is quite common for all five types of automation capabilities in Digital Business Automation to be needed. However, the job of our Automation Alignment Matrix is to help us narrow down automation for specific types of work. We can also leverage a tool like IBM Blueworks Live to model out our processes and analyze what type of work is being done. This will prepare us to use the Automation Alignment Matrix since we’ll have classified the work as either Exploratory, Transactional, or Programmatic.  

Our objective in this blog is to look at Task Automation in the context of all three types of work. 

Programmatic: 

This is the sweet spot for Task AutomationWhether high volume or low volume, if the work is programmatic in nature, meaning we can fully define the work up-front, then Task Automation should be leveragedWhether that Task Automation is accomplished by Robotic Process Task Automation, a low/no-code application development tool, or an application integration platform really depends on the level of flexibility you need, as well as the time to market required. If the tasks to be automated include the need for integration with legacy systems or your time to market requirements are very high, then RPA should be a consideration. 

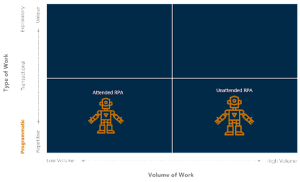
Figure 4 represents how Task Automation fits into the Automation Alignment Framework for Programmatic work. We’ve made the Tasks icon for the High Volume / Programmatic quadrant larger than the Tasks Icon in the Low Volume / Programmatic quadrant since we believe Task Automation is more prevalent in the High Volume / Programmatic quadrant.  

The lower the volume of work, the less likely it is a company will want to automate it, especially for low-value mundane work. If it doesn’t happen very often, and it doesn’t cost you much to have someone do it, then you may not want to automate it. It may be sufficient to have the work done as part of a swivel-chair type workflow. Alternatively, if the work is predictable, repetitive, and high-volume, then that is a great place to look at Task Automation, and RPA in particular. However, there are caveats to this as the typical RPA implementation is limited by how quickly it can open and fill in screens (after all, when all is said and done RPA is sophisticated screen scraping). If you get into too high of a volume situation, then application integration may be a better choice. Of course, if you are automating what was previously done entirely manually, then we suspect any performance concerns would be a red herring, and RPA may be an excellent choice, at least in the short-term. 

Transactional: 


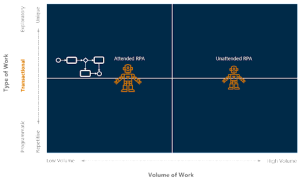
Transactional work, which can mostly be prescribed ahead of time, but typically requires human intervention, tends to be the domicile of workflow. However, within those workflows, many times there will be specific tasks which can be automated. Attended RPA would tend to play a more prominent role than Unattended RPA hereIn Figure 5, we display the Transactional view of our Automation Alignment Matrix for Task Automation.  

We display a Workflow icon here because this area is typically where Workflow is most prevalent, and other automation capabilities are called from the workflow. In this case, we see Attended and Unattended RPA are possibilities, although the icons are smaller than for Programmatic work since there is less opportunity for Task Automation. Also, the icon for Attended RPA is larger than the icon for Unattended RPA since Transactional work tends to be guided by humans, and the workflow can change based on what the human observes. 

Exploratory: 

Exploratory work is, by definition, unpredictable. The very word explore brings to mind going off and doing exciting and unforeseeable things. Every company has a ton of exploratory work. This work is typically the highest value work done at a company. This area houses your knowledge workers, and we predict this is where automation will eventually drive all human workers to live. Applying prescribed automation to exploratory work becomes much more difficult than the other types of work, if not impossible. Think about the work your executive teams typically do. Mostly, it is making decisions and delegating work based on their experience and knowledge of the business. Trying to predict those decisions and actions through highly controlled sequential workflows would be a recipe for disaster. 

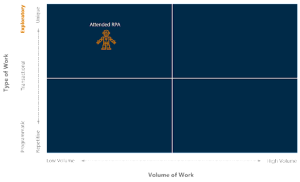
Because of the nature of exploratory work, Task Automation, and RPA, in particular, will not play a significant role here. Thus, we’ll have a tiny Attended RPA icon in the Exploratory / Low Volume quadrant. For the Exploratory / High Volume quadrant, we won’t have Task Automation at all since there isn’t that much high volume exploratory work anyway, and also we don’t see a great fit for Task Automation in that quadrant. 

Tying it all Together 

As we mentioned in the first paragraph of this blog, this is Part 3 in a series of blogs (Part 1Part 2) on taking a holistic approach to automation when leveraging Digital Business Automation. Hopefully, this blog will help you avoid what we see happening in some automation efforts; RPA as a panacea for all things automation related. RPA is outstanding in some situations, but you need an overall approach to automation which allows you to take a look at the big picture and determine what type of work you’re doing, and then what automation, if any, fits best with that work.