
Introducing, the Automation Compass, a tool built by digital business automation professionals, for business automation professionals. Our team built this one-of-a-kind solution to help you consistently deliver digital business automation and process improvement results without the headache.
Our team has conducted extensive interviews with a many leaders and practitioners in the field to gain a deeper understanding of their challenges and pain points. In this blog, we’ll delve into those challenges and show you how Automation Compass is the solution you’ve been searching for.
Not a reader? Watch the demo here
Digital business automation and process improvement can be a daunting task. With multiple spreadsheets, visio diagrams, and a seemingly endless list of ideas and opportunities, it can be challenging to know where to start. Prioritizing these ideas, analyzing their impact on various factors such as time saved, cost savings, and customer experience, aligning them with corporate goals, and calculating ROI can be even more challenging. Knowing how to…
On top of that, how do you keep track of it all and secure executive sponsorship to put your top priorities into action?
When conducting our interviews with industry experts, not one person was able to say they were managing and aligning all of the challenges above without the help of Automation Compass.
Automation Compass is a tool created to can help identify opportunities for process improvement and automation within a business. This tool is Salient’s one-of-a-kind solution that allows users to analyze and assess their business processes, identify areas where automation may be beneficial, and align the opportunities to the overall business objectives. By using Automation Compass, you can create endless scenarios for your processes to navigate towards your North Star.
With Automation Compass your team can
Let’s walk through the steps of how to successfully use Automation Compass
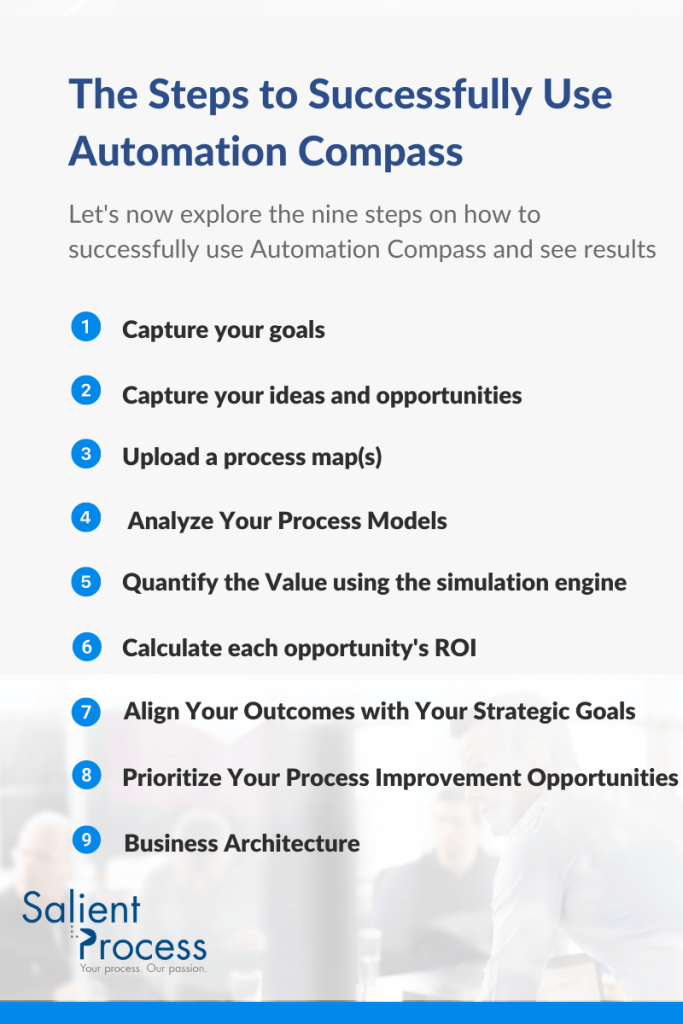
Developed by a team of industrial engineers, data scientists, automation developers, and designers, the features and functions of the Automation Compass are based on input from real-life automation and process improvement practitioners and end-users. This means that every aspect of the Automation Compass has been carefully crafted to simplify your life. But how does it achieve this?
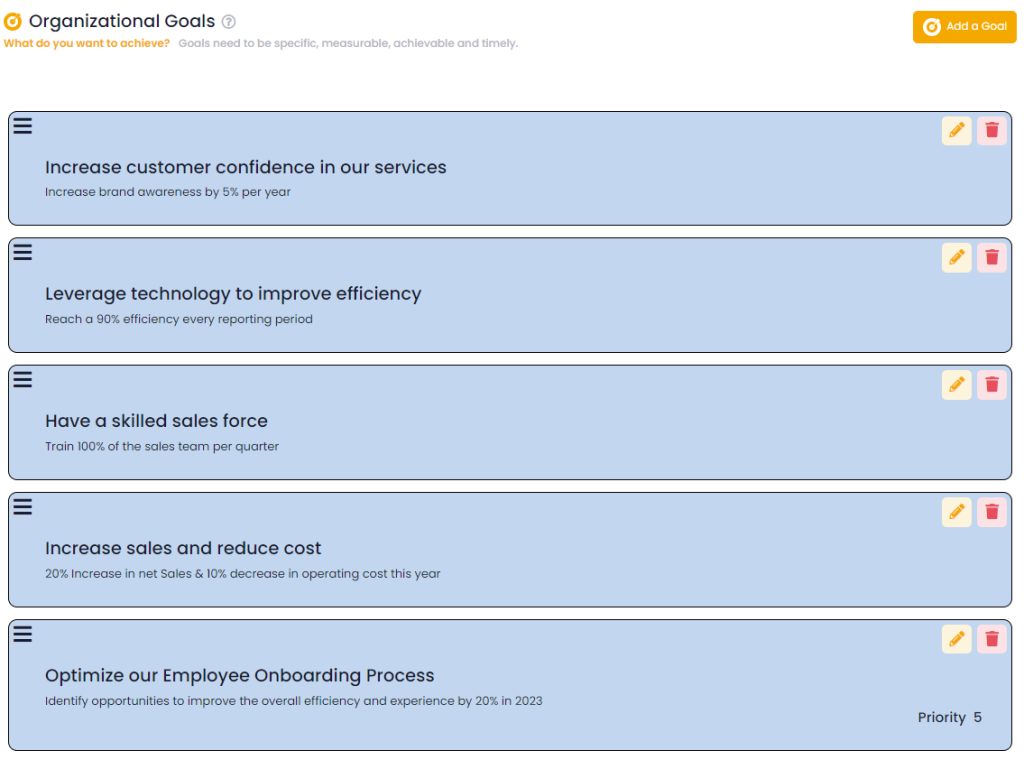
Every successful digital business automation and process improvement team has a goal or set of goals. Common objectives include:
Chances are, your company has multiple goals. High-performing teams also quantify their goals, such as “aiming to remove $100 million in Sales, General, and Administrative (SG&A) expenses over the next 18 months.” Often, these goals are noted in an “Annual Business Plan” PowerPoint presentation and are forgotten. Sound familiar? Automation Compass not only keeps your goals in one place, but it also aligns your mapping and analysis work with your stated goals and objectives. By capturing specific, measurable, timely, and achievable goals, Automation Compass provides your team with a clear direction for identifying opportunities for improvement and automation, keeping them at the forefront all year.
In addition, your team has the ability to prioritize each of these goals based on the level of importance your team determines because it helps to focus your organization’s efforts and resources on the most critical areas. Without prioritization, organizations may try to improve everything at once, which can lead to a diffuse and ineffective approach.
(If you don’t have ideas at this point in time, that’s fine! Jump ahead to step 3: “Upload a Process Map”)
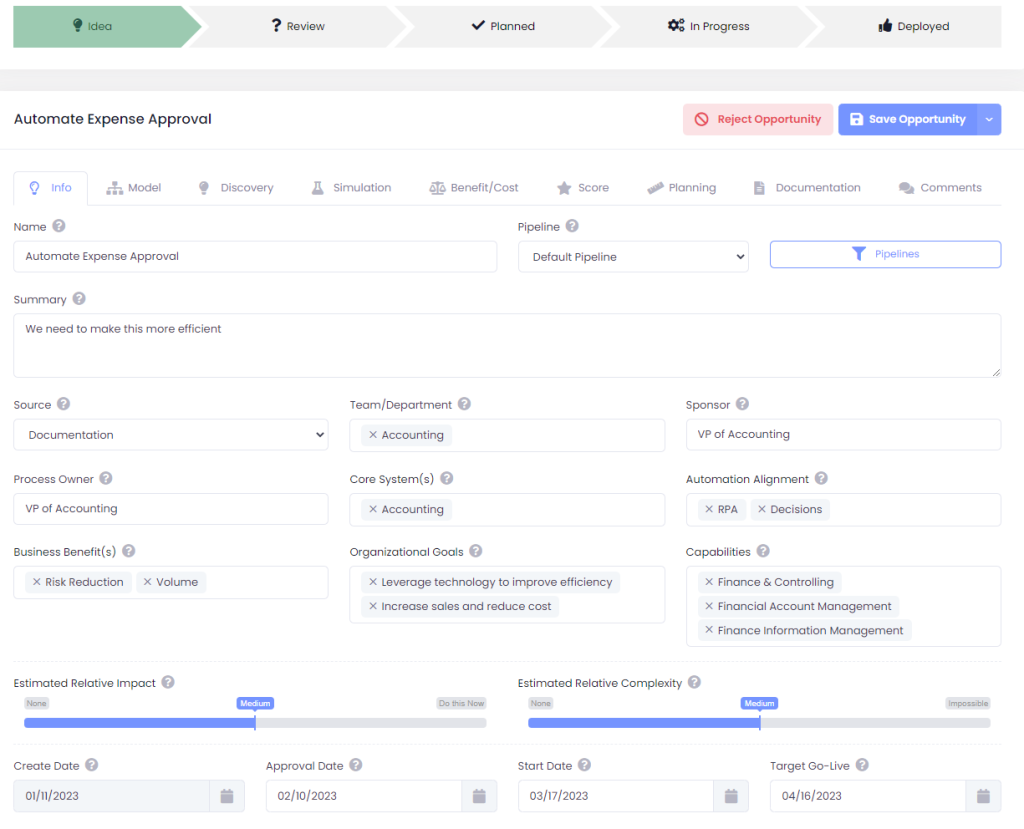
If you’ve been working on digital business automation and process improvement for some time, you probably have a list of ideas and opportunities that can help you achieve your goals. You might have stored these ideas on a spreadsheet, and you might have assigned some metrics to prioritize them. Assuming you store these ideas where they are shareable and collaborative as well. While this might work for you, we’ve learned that this approach can be time-consuming and headache-inducing, especially when you need to manage, sort, and share the latest version.
While using a spreadsheet is a good starting point, it can quickly become overwhelming as your list grows. With Automation Compass, you can upload your list of opportunities and their properties, and then manage them easily with tags, overlays, dashboards, and pipelines. When creating an opportunity, this feature allows you to capture all of the information necessary for you to justify and track your initiatives.
If you already have your ideas and opportunities, you can jump straight to step 6: “Calculate each opportunity’s ROI.
If your team has not yet captured a list of opportunities, that’s okay. Most people find their opportunities through process mapping and analysis activities. You can build a list from scratch or using a template, import it from your preferred modeling or mining tool, or seamlessly integrate the Automation Compass with IBM Blueworks Live. Once you have a process model in the Automation Compass, the next step is to use AI-assistance to identify ideas and opportunities.
You will undoubtedly come up with ideas for improvement and automation while mapping processes, and you should capture these as described in step 2, “Capture your Ideas and Opportunities.” But why not get a little help from AI?
IBM Watson’s Natural Language Processing API scans your process models and generates confidence intervals for various automation ideas and opportunities in Workflow, RPA, Business Rules Management, Content Management, and Intelligent OCR. Each process could contain one or multiple ideas and opportunities, and for that, we say, “the more, the merrier!” Once you have generated several ideas and opportunities, you can quantify and score them.
The opportunity identification feature allows companies to more effectively evaluate the potential benefits of process improvement and automation initiatives and make informed decisions about which initiatives are worth pursuing.
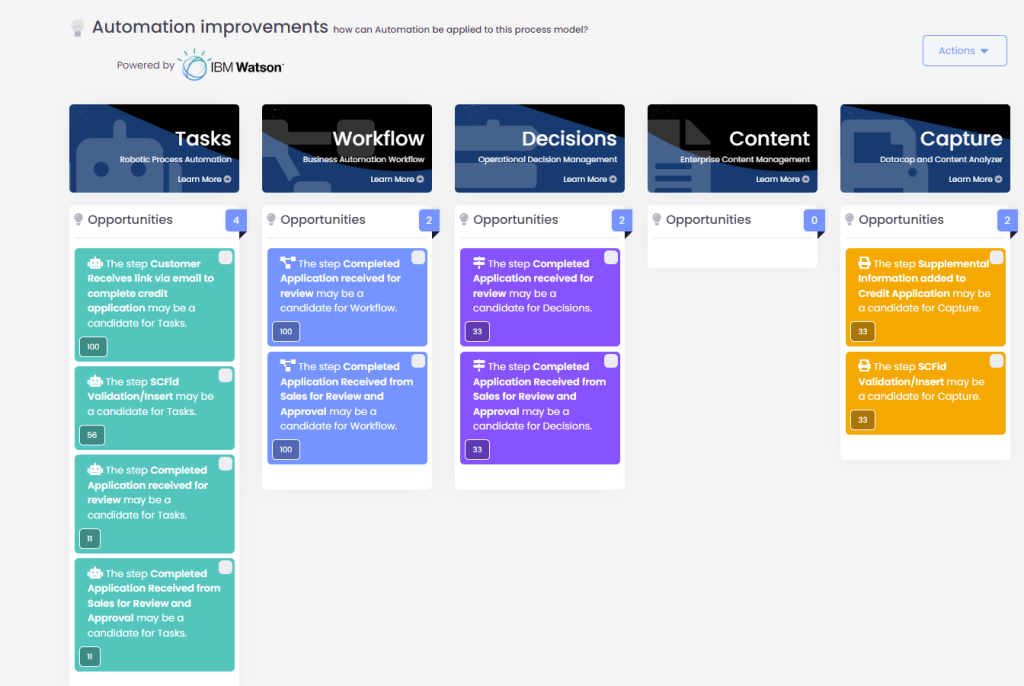
The images show different ways to view the identified Automation Opportunities. The dashboard categorizes the opportunities by the color of the automation solution that can improve the process. Image 1 displays the opportunities as a kanban board and highlights four areas where Task Automation (RPA) can be applied. Image 2 presents the same information in a process map view, with icons indicating the specific processes that can be improved. Here we can again see the same four areas where Task Automation (RPA) can be applied.
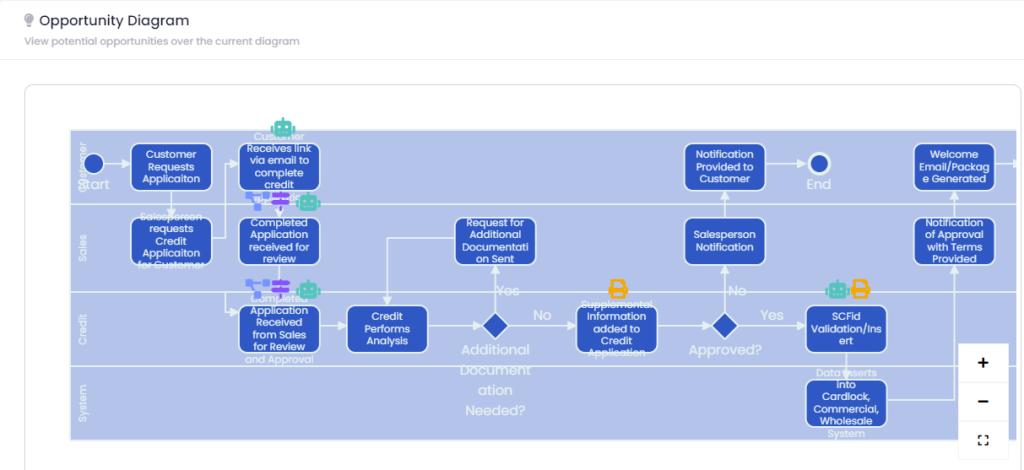
Whether you’re prioritizing by cost reduction, cycle time, resource utilization, or virtually any data measure, Automation Compass’s built-in simulation engine can quantify the value of each opportunity you’ve identified. Automation rarely comes for free, so we need to account for the resource cost of achieving each opportunity. This allows us to make informed business decisions about where to start improving. The next step is to calculate the ROI of each opportunity.
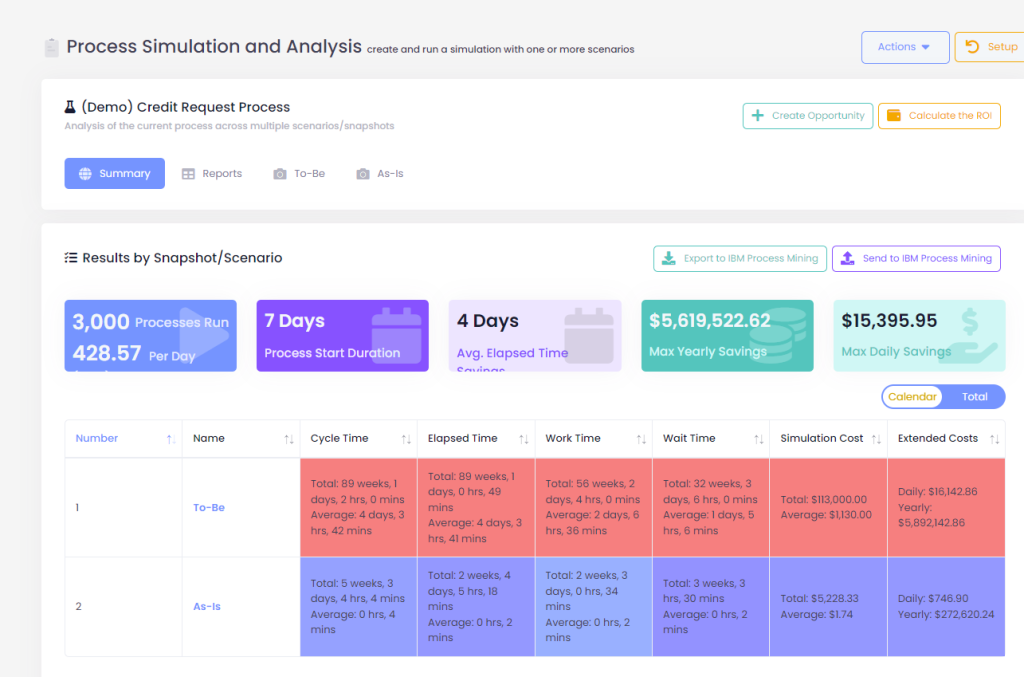
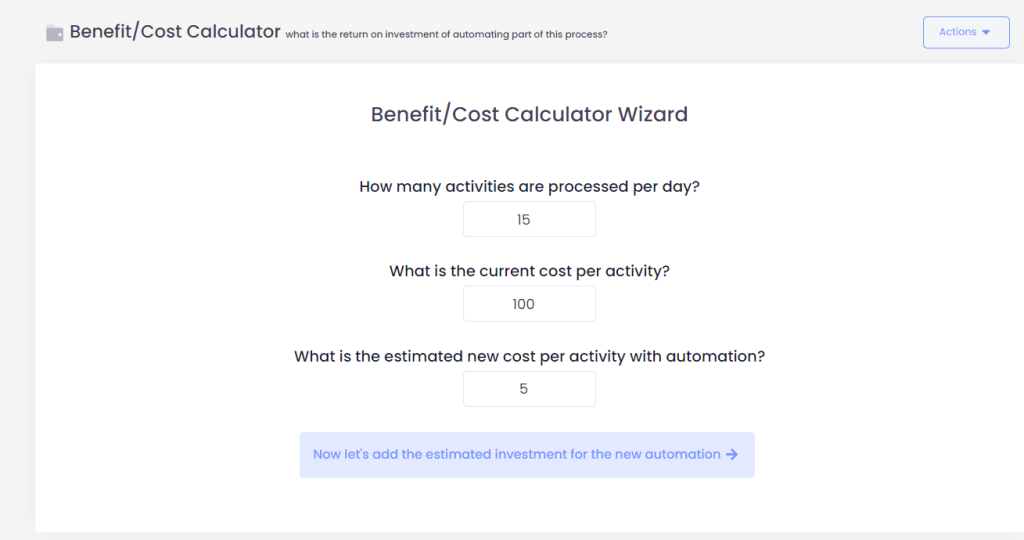
Value is rarely free, so it’s important to account for overhead costs such as software, internal or vendor services, and implementation time. The Automation Compass features a guided wizard that simplifies the calculation of ROI for each opportunity, presented in the format of your choice: payback period, Net Present Value, or annual cost savings. The visual presentation of the results makes reporting and creating business cases easy. Now you can align each quantified opportunity with the goals captured in step one, completing the full circle.
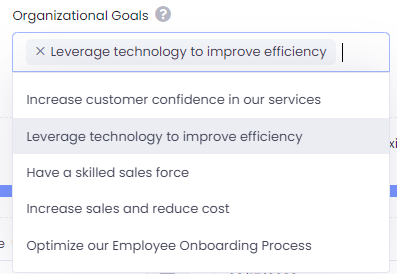
Every idea and opportunity generated and analyzed by your team should align with the goal(s) captured in step 1. If it doesn’t align, put it at the bottom of the list. Aligning your opportunities with your goals makes sense and is a simple yet effective practice. Unfortunately, it’s often not done well today and when it is, it’s usually spread across multiple files like Excel and PowerPoint. Does this sound familiar?
The million-dollar question is “Where do we start, what do we automate first?” The answer lies in prioritization. After following each of the steps above, you have done everything possible through human and programmatic analysis to answer this question. You can prioritize by impact-complexity or choose straight net present value, it’s up to you.
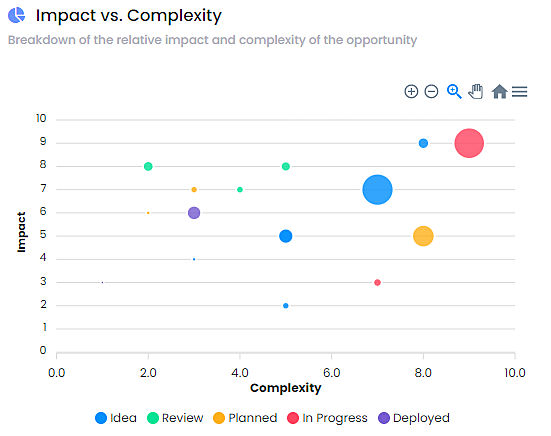
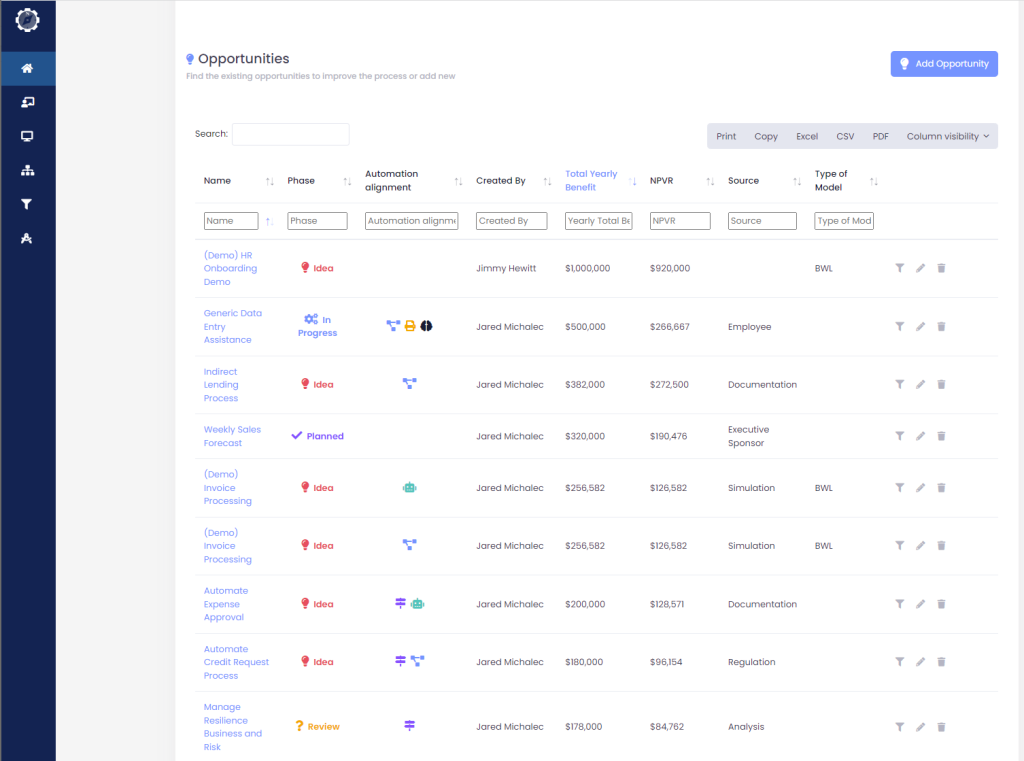
But wait, there’s more! Arguably the most powerful capability of the Automation Compass is the interactive Business Architecture module. As you see below, you can now visualize your business in a logical taxonomy or framework. It also helps you visualize the relative progress that you’ve made with heatmaps. And last but not least, you can save the opportunities that you’ve found and quantified previously at the exact location in which they belong within your business architecture! This is our answer to the countless interviews that we’ve conducted, this is how to manage your automation and process improvement program all in one place.
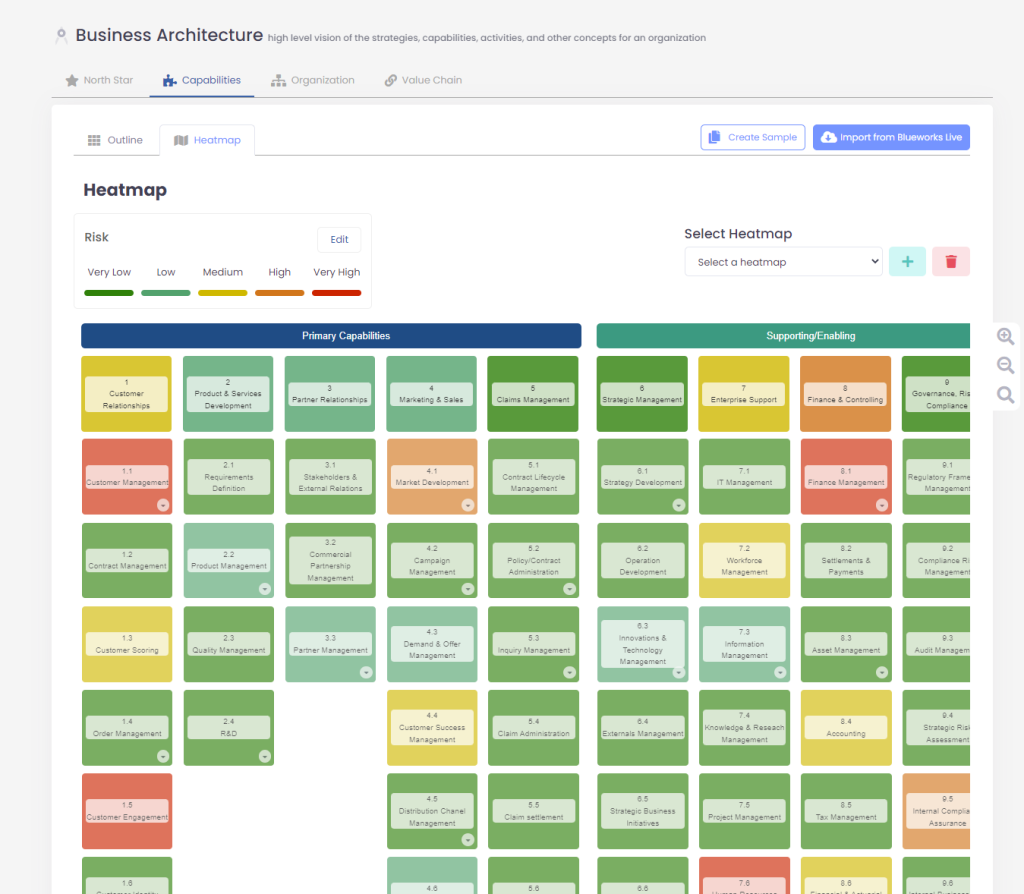
In conclusion, the Automation Compass eliminates the stress of manual processes and provides you with a streamlined solution to achieve your digital business automation and process improvement goals.
Say goodbye to tedious spreadsheets and Visio diagrams, and hello to increased results and a headache-free experience.

If you’re interested in learning more, you can request a free trial or a demo from an expert advisor. If you’re eager to get started, take advantage of Salient’s limited time Early Adopter program with heavily discounted pricing. Don’t miss out on this opportunity, inquire for more information today.